Cabela's 2011 Annual Report Download - page 111
Download and view the complete annual report
Please find page 111 of the 2011 Cabela's annual report below. You can navigate through the pages in the report by either clicking on the pages listed below, or by using the keyword search tool below to find specific information within the annual report.-
 1
1 -
2
-
3
-
4
-
5
-
6
-
7
-
8
-
9
-
10
-
11
-
12
-
13
-
14
-
15
-
16
-
17
-
18
-
19
-
20
-
21
-
22
-
23
-
24
-
25
-
26
-
27
-
28
-
29
-
30
-
31
-
32
-
33
-
34
-
35
-
36
-
37
-
38
-
39
-
40
-
41
-
42
-
43
-
44
-
45
-
46
-
47
-
48
-
49
-
50
-
51
-
52
-
53
-
54
-
55
-
56
-
57
-
58
-
59
-
60
-
61
-
62
-
63
-
64
-
65
-
66
-
67
-
68
-
69
-
70
-
71
-
72
-
73
-
74
-
75
-
76
-
77
-
78
-
79
-
80
-
81
-
82
-
83
-
84
-
85
-
86
-
87
-
88
-
89
-
90
-
91
-
92
-
93
-
94
-
95
-
96
-
97
-
98
-
99
-
100
-
 101
101 -
 102
102 -
 103
103 -
 104
104 -
 105
105 -
 106
106 -
 107
107 -
 108
108 -
 109
109 -
 110
110 -
 111
111 -
 112
112 -
 113
113 -
 114
114 -
 115
115 -
 116
116 -
 117
117 -
 118
118 -
 119
119 -
 120
120 -
 121
121 -
122
-
123
-
124
-
125
-
126
-
127
-
128
-
129
-
130
-
131
-
132
 |
 |

101
CABELA’S INCORPORATED AND SUBSIDIARIES
NOTES TO CONSOLIDATED FINANCIAL STATEMENTS
(Dollars in Thousands Except Share and Per Share Amounts)
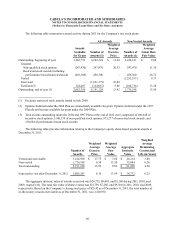
22. EARNINGS PER SHARE
The following table reconciles the number of shares utilized in the earnings per share calculations for the
years ended:
2011 2010 2009
Weighted average number of shares:
Common shares – basic 69,194,663 67,791,782 67,007,656
Effect of incremental dilutive securities:
Stock options, nonvested stock units, and
employee stock purchase plans 2,079,579 1,294,751 445,818
Common shares – diluted 71,274,242 69,086,533 67,453,474
Stock options outstanding and nonvested stock units issued
considered anti-dilutive excluded from calculation 228,545 2,571,955 4,130,935
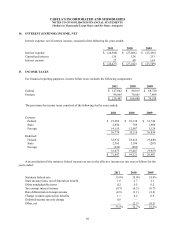
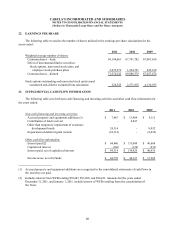
23. SUPPLEMENTAL CASH FLOW INFORMATION
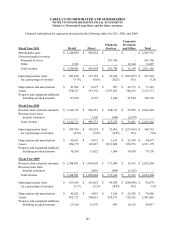
The following table sets forth non-cash financing and investing activities and other cash flow information for
the years ended:
2011 2010 2009
Non-cash financing and investing activities:
Accrued property and equipment additions (1) $ 7,483 $ 13,484 $ 9,112
Contribution of land received - 6,847 -
Other than temporary impairment of economic
development bonds 24,314 - 8,032
Impairment of deferred grant income (24,314) - (8,032)
Other cash flow information:
Interest paid (2) $ 94,440 $ 135,049 $ 40,668
Capitalized interest (126) (124) (233)
Interest paid, net of capitalized interest $ 94,314 $ 134,925 $ 40,435
Income taxes, net of refunds $ 44,778 $ 44,127 $ 17,282
(1) Accrued property and equipment additions are recognized in the consolidated statements of cash flows in
the year they are paid.
(2) Includes interest from WFB totaling $70,867, $93,908, and $24,433. Amounts for the years ended
December 31, 2011, and January 1, 2011, include interest of WFB resulting from the consolidation of
the Trust.