Cabela's 2011 Annual Report Download - page 94
Download and view the complete annual report
Please find page 94 of the 2011 Cabela's annual report below. You can navigate through the pages in the report by either clicking on the pages listed below, or by using the keyword search tool below to find specific information within the annual report.-
 1
1 -
2
-
3
-
4
-
5
-
6
-
7
-
8
-
9
-
10
-
11
-
12
-
13
-
14
-
15
-
16
-
17
-
18
-
19
-
20
-
21
-
22
-
23
-
24
-
25
-
26
-
27
-
28
-
29
-
30
-
31
-
32
-
33
-
34
-
35
-
36
-
37
-
38
-
39
-
40
-
41
-
42
-
43
-
44
-
45
-
46
-
47
-
48
-
49
-
50
-
51
-
52
-
53
-
54
-
55
-
56
-
57
-
58
-
59
-
60
-
61
-
62
-
63
-
64
-
65
-
66
-
67
-
68
-
69
-
70
-
71
-
72
-
73
-
74
-
75
-
76
-
77
-
78
-
79
-
80
-
81
-
82
-
83
-
 84
84 -
 85
85 -
 86
86 -
 87
87 -
 88
88 -
 89
89 -
 90
90 -
 91
91 -
 92
92 -
 93
93 -
 94
94 -
 95
95 -
 96
96 -
 97
97 -
 98
98 -
 99
99 -
 100
100 -
 101
101 -
 102
102 -
 103
103 -
 104
104 -
105
-
106
-
107
-
108
-
109
-
110
-
111
-
112
-
113
-
114
-
115
-
116
-
117
-
118
-
119
-
120
-
121
-
122
-
123
-
124
-
125
-
126
-
127
-
128
-
129
-
130
-
131
-
132
 |
 |

84
CABELA’S INCORPORATED AND SUBSIDIARIES
NOTES TO CONSOLIDATED FINANCIAL STATEMENTS
(Dollars in Thousands Except Share and Per Share Amounts)
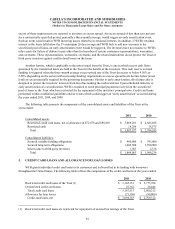
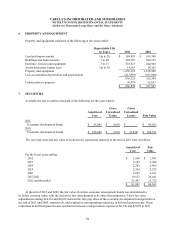
6. PROPERTY AND EQUIPMENT
Property and equipment consisted of the following at the years ended:
Depreciable Life
in Years 2011 2010
Land and improvements Up to 20 $ 169,839 $ 169,398
Buildings and improvements 7 to 40 549,793 500,193
Furniture, fixtures and equipment 3 to 15 516,323 444,948
Assets held under capital lease Up to 30 14,363 14,363
Property and equipment 1,250,318 1,128,902
Less accumulated depreciation and amortization (413,993) (363,608)
836,325 765,294
Construction in progress 30,574 52,653
$ 866,899 $ 817,947
7. SECURITIES
Available-for-sale securities consisted of the following for the years ended:
Amortized
Cost
Gross
Unrealized
Gains
Gross
Unrealized
Losses Fair Value
2011:
Economic development bonds $ 81,881 $ 4,682 $ - $ 86,563
2010:
Economic development bonds $ 108,640 $ 2,045 $ (6,454) $ 104,231
The carrying value and fair value of securities by contractual maturity at the end of 2011 were as follows:
Amortized
Cost
Fair
Value
For the fiscal years ending:
2012 $ 1,836 $ 1,991
2013 2,145 2,304
2014 2,283 2,469
2015 2,324 2,525
2016 2,693 2,911
2017-2021 19,153 20,641
2022 and thereafter 51,447 53,722
$ 81,881 $ 86,563
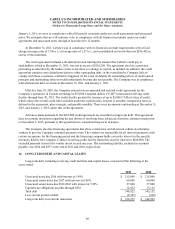
At the end of 2011 and 2009, the fair value of certain economic development bonds was determined to
be below carrying value, with the decline in fair value deemed to be other than temporary. These fair value
adjustments totaling $24,314 and $8,032 reduced the carrying value of the economic development bond portfolio at
the end of 2011 and 2009, respectively, and resulted in corresponding reductions in deferred grant income. These
reductions in deferred grant income resulted in increases in depreciation expense of $6,538 and $2,099 in 2011