Cabela's 2011 Annual Report Download - page 79
Download and view the complete annual report
Please find page 79 of the 2011 Cabela's annual report below. You can navigate through the pages in the report by either clicking on the pages listed below, or by using the keyword search tool below to find specific information within the annual report.-
 1
1 -
2
-
3
-
4
-
5
-
6
-
7
-
8
-
9
-
10
-
11
-
12
-
13
-
14
-
15
-
16
-
17
-
18
-
19
-
20
-
21
-
22
-
23
-
24
-
25
-
26
-
27
-
28
-
29
-
30
-
31
-
32
-
33
-
34
-
35
-
36
-
37
-
38
-
39
-
40
-
41
-
42
-
43
-
44
-
45
-
46
-
47
-
48
-
49
-
50
-
51
-
52
-
53
-
54
-
55
-
56
-
57
-
58
-
59
-
60
-
61
-
62
-
63
-
64
-
65
-
66
-
67
-
68
-
 69
69 -
 70
70 -
 71
71 -
 72
72 -
 73
73 -
 74
74 -
 75
75 -
 76
76 -
 77
77 -
 78
78 -
 79
79 -
 80
80 -
 81
81 -
 82
82 -
 83
83 -
 84
84 -
 85
85 -
 86
86 -
 87
87 -
 88
88 -
 89
89 -
90
-
91
-
92
-
93
-
94
-
95
-
96
-
97
-
98
-
99
-
100
-
101
-
102
-
103
-
104
-
105
-
106
-
107
-
108
-
109
-
110
-
111
-
112
-
113
-
114
-
115
-
116
-
117
-
118
-
119
-
120
-
121
-
122
-
123
-
124
-
125
-
126
-
127
-
128
-
129
-
130
-
131
-
132
 |
 |

69
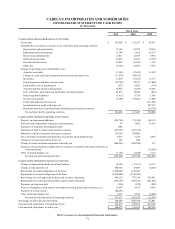
CABELA’S INCORPORATED AND SUBSIDIARIES
CONSOLIDATED STATEMENTS OF INCOME
(Dollars in Thousands Except Earnings Per Share)
Fiscal Years
2011 2010 2009
Revenue:
Merchandise sales $ 2,505,733 $ 2,412,486 $ 2,447,635
Financial Services revenue 291,746 227,675 171,414
Other revenue 13,687 23,081 13,191
Total revenue 2,811,166 2,663,242 2,632,240
Cost of revenue:
Merchandise costs 1,613,241 1,566,165 1,601,136
Cost of other revenue 8 9,284 1,485
Total cost of revenue (exclusive of depreciation and amortization) 1,613,249 1,575,449 1,602,621
Selling, distribution, and administrative expenses 954,125 895,405 870,147
Impairment and restructuring charges 12,244 5,626 66,794
Operating income 231,548 186,762 92,678
Interest expense, net (24,427) (27,442) (23,109)
Other non-operating income, net 7,346 7,360 6,955
Income before provision for income taxes 214,467 166,680 76,524
Provision for income taxes 71,847 54,521 26,907
Net income $ 142,620 $ 112,159 $ 49,617
Earnings per basic share $ 2.06 $ 1.65 $ 0.74
Earnings per diluted share $ 2.00 $ 1.62 $ 0.74
Basic weighted average shares outstanding 69,194,663 67,791,782 67,007,656
Diluted weighted average shares outstanding 71,274,242 69,086,533 67,453,474
Refer to notes to consolidated financial statements.