Cabela's 2011 Annual Report Download - page 48
Download and view the complete annual report
Please find page 48 of the 2011 Cabela's annual report below. You can navigate through the pages in the report by either clicking on the pages listed below, or by using the keyword search tool below to find specific information within the annual report.-
 1
1 -
2
-
3
-
4
-
5
-
6
-
7
-
8
-
9
-
10
-
11
-
12
-
13
-
14
-
15
-
16
-
17
-
18
-
19
-
20
-
21
-
22
-
23
-
24
-
25
-
26
-
27
-
28
-
29
-
30
-
31
-
32
-
33
-
34
-
35
-
36
-
37
-
 38
38 -
 39
39 -
 40
40 -
 41
41 -
 42
42 -
 43
43 -
 44
44 -
 45
45 -
 46
46 -
 47
47 -
 48
48 -
 49
49 -
 50
50 -
 51
51 -
 52
52 -
 53
53 -
 54
54 -
 55
55 -
 56
56 -
 57
57 -
 58
58 -
59
-
60
-
61
-
62
-
63
-
64
-
65
-
66
-
67
-
68
-
69
-
70
-
71
-
72
-
73
-
74
-
75
-
76
-
77
-
78
-
79
-
80
-
81
-
82
-
83
-
84
-
85
-
86
-
87
-
88
-
89
-
90
-
91
-
92
-
93
-
94
-
95
-
96
-
97
-
98
-
99
-
100
-
101
-
102
-
103
-
104
-
105
-
106
-
107
-
108
-
109
-
110
-
111
-
112
-
113
-
114
-
115
-
116
-
117
-
118
-
119
-
120
-
121
-
122
-
123
-
124
-
125
-
126
-
127
-
128
-
129
-
130
-
131
-
132
 |
 |

38
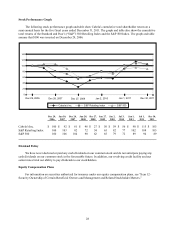
We continue to focus on smaller, more specialized catalogs, and we have reduced the number of catalog pages
mailed and decreased total circulation, leading to continued reductions in catalog related costs. Mostly offsetting
the reductions in catalog related costs were increases in Internet related expenses due to our expanded use of digital
marketing channels and enhancements to our website.
2011 2010
Increase
(Decrease) % Change
Percentage increase year over year in Internet website visitors 4.5% 5.8%
Catalog circulation in pages (in millions) (1) 22,218 24,028 (1,810) (7.5)%
Number of separate catalog titles circulated (1) 102 98 4
(1) 2010 amounts were adjusted to reflect the activity related to the divestiture of our non-core home restoration
products business.
Financial Services Revenue – The following table sets forth the components of our Financial Services
revenue for the years ended:
2011 2010
Increase
(Decrease) % Change
(Dollars in Thousands)
Interest and fee income $ 277,242 $ 271,651 $ 5,591 2.1%
Interest expense (70,303) (86,494) (16,191) (18.7)
Provision for loan losses (39,287) (66,814) (27,527) (41.2)
Net interest income, net of provision for loan losses 167,652 118,343 49,309 41.7
Non-interest income:
Interchange income 267,106 231,347 35,759 15.5
Other non-interest income 13,620 12,247 1,373 11.2
Total non-interest income 280,726 243,594 37,132 15.2
Less: Customer rewards costs (156,632) (134,262) 22,370 16.7
Financial Services revenue $ 291,746 $ 227,675 $ 64,071 28.1
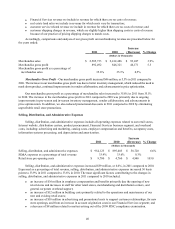
Financial Services revenue increased $64 million, or 28.1%, in 2011 compared to 2010. The increase in
interest and fee income of $6 million was due to an increase in credit card loans and a reduction in charge-offs
of cardholder fees and interest, partially offset with a decrease in interest and fees charged as a result of the
CARD Act. Interest expense decreased $16 million due to decreases in interest rates. The provision for loan losses
decreased $28 million due to favorable charge-off trends and an improved outlook on the quality of our credit card
portfolio as of the end of 2011 compared to 2010, evidenced by lower delinquencies and delinquency roll-rates
comparing the respective periods. The increase in interchange income of $36 million and customer rewards costs
of $22 million was due to an increase in credit card purchases.
The following table sets forth the components of our Financial Services revenue as a percentage of average
credit card loans, including any accrued interest and fees, for the years ended:
2011 2010
Interest and fee income 10.1% 11.0%
Interest expense (2.6) (3.5)
Provision for loan losses (1.4) (2.7)
Interchange income 9.7 9.4
Other non-interest income 0.5 0.5
Customer rewards costs (5.7) (5.5)
Financial Services revenue 10.6% 9.2%