Cabela's 2011 Annual Report Download - page 117
Download and view the complete annual report
Please find page 117 of the 2011 Cabela's annual report below. You can navigate through the pages in the report by either clicking on the pages listed below, or by using the keyword search tool below to find specific information within the annual report.-
 1
1 -
2
-
3
-
4
-
5
-
6
-
7
-
8
-
9
-
10
-
11
-
12
-
13
-
14
-
15
-
16
-
17
-
18
-
19
-
20
-
21
-
22
-
23
-
24
-
25
-
26
-
27
-
28
-
29
-
30
-
31
-
32
-
33
-
34
-
35
-
36
-
37
-
38
-
39
-
40
-
41
-
42
-
43
-
44
-
45
-
46
-
47
-
48
-
49
-
50
-
51
-
52
-
53
-
54
-
55
-
56
-
57
-
58
-
59
-
60
-
61
-
62
-
63
-
64
-
65
-
66
-
67
-
68
-
69
-
70
-
71
-
72
-
73
-
74
-
75
-
76
-
77
-
78
-
79
-
80
-
81
-
82
-
83
-
84
-
85
-
86
-
87
-
88
-
89
-
90
-
91
-
92
-
93
-
94
-
95
-
96
-
97
-
98
-
99
-
100
-
101
-
102
-
103
-
104
-
105
-
106
-
 107
107 -
 108
108 -
 109
109 -
 110
110 -
 111
111 -
 112
112 -
 113
113 -
 114
114 -
 115
115 -
 116
116 -
 117
117 -
 118
118 -
 119
119 -
 120
120 -
 121
121 -
 122
122 -
 123
123 -
 124
124 -
 125
125 -
 126
126 -
 127
127 -
128
-
129
-
130
-
131
-
132
 |
 |

107
CABELA’S INCORPORATED AND SUBSIDIARIES
NOTES TO CONSOLIDATED FINANCIAL STATEMENTS
(Dollars in Thousands Except Share and Per Share Amounts)
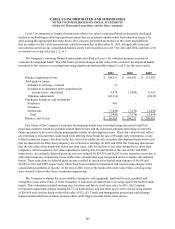
26. QUARTERLY FINANCIAL INFORMATION (UNAUDITED)
The following table sets forth unaudited financial and operating data in each quarter for years 2011 and 2010:
2011 by Quarter 2010 by Quarter
First Second Third Fourth First Second Third Fourth
Total revenue $ 586,711 $ 562,100 $ 678,610 $ 983,745 $ 559,610 $ 525,970 $ 643,251 $ 934,411
Operating income (1) 30,887 37,309 53,489 109,863 15,939 30,669 36,641 103,513
Net income 17,785 21,700 33,307 69,828 8,091 18,024 19,742 66,302
Earnings per basic share (2) 0.26 0.31 0.48 1.03 0.12 0.27 0.29 0.97
Earnings per diluted share (2) 0.25 0.31 0.47 1.00 0.12 0.26 0.29 0.95
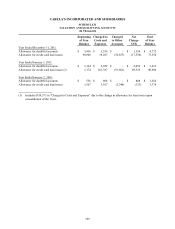
(1) Includes impairment and
restructuring charges that
the Company recorded
by quarter as follows: - 955 3,488 7,801 - 1,834 2,997 795
(2) Basic and diluted earnings per share are computed independently for each of the quarters presented and,
therefore, may not sum to the totals for the year.
Revenue is typically higher in the Company’s third and fourth quarters than in the first and second quarters
due to holiday buying patterns and hunting and fishing season openings across the United States. The Company’s
quarterly operating results may fluctuate significantly as a result of these events and a variety of other factors, and
operating results for any quarter are not necessarily indicative of results for a full year.