Cabela's 2011 Annual Report Download - page 35
Download and view the complete annual report
Please find page 35 of the 2011 Cabela's annual report below. You can navigate through the pages in the report by either clicking on the pages listed below, or by using the keyword search tool below to find specific information within the annual report.-
 1
1 -
2
-
3
-
4
-
5
-
6
-
7
-
8
-
9
-
10
-
11
-
12
-
13
-
14
-
15
-
16
-
17
-
18
-
19
-
20
-
21
-
22
-
23
-
24
-
 25
25 -
 26
26 -
 27
27 -
 28
28 -
 29
29 -
 30
30 -
 31
31 -
 32
32 -
 33
33 -
 34
34 -
 35
35 -
 36
36 -
 37
37 -
 38
38 -
 39
39 -
 40
40 -
 41
41 -
 42
42 -
 43
43 -
 44
44 -
 45
45 -
46
-
47
-
48
-
49
-
50
-
51
-
52
-
53
-
54
-
55
-
56
-
57
-
58
-
59
-
60
-
61
-
62
-
63
-
64
-
65
-
66
-
67
-
68
-
69
-
70
-
71
-
72
-
73
-
74
-
75
-
76
-
77
-
78
-
79
-
80
-
81
-
82
-
83
-
84
-
85
-
86
-
87
-
88
-
89
-
90
-
91
-
92
-
93
-
94
-
95
-
96
-
97
-
98
-
99
-
100
-
101
-
102
-
103
-
104
-
105
-
106
-
107
-
108
-
109
-
110
-
111
-
112
-
113
-
114
-
115
-
116
-
117
-
118
-
119
-
120
-
121
-
122
-
123
-
124
-
125
-
126
-
127
-
128
-
129
-
130
-
131
-
132
 |
 |

25
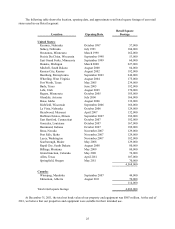
The following table shows the location, opening date, and approximate retail total square footage of our retail
stores used in our Retail segment:
Location Opening Date
Retail Square
Footage
United States:
Kearney, Nebraska October 1987 57,000
Sidney, Nebraska July 1991 104,000
Owatonna, Minnesota March 1998 162,000
Prairie Du Chien, Wisconsin September 1998 53,000
East Grand Forks, Minnesota September 1999 60,000
Dundee, Michigan March 2000 227,000
Mitchell, South Dakota August 2000 84,000
Kansas City, Kansas August 2002 192,000
Hamburg, Pennsylvania September 2003 246,000
Wheeling, West Virginia August 2004 175,000
Fort Worth, Texas May 2005 234,000
Buda, Texas June 2005 192,000
Lehi, Utah August 2005 170,000
Rogers, Minnesota October 2005 185,000
Glendale, Arizona July 2006 166,000
Boise, Idaho August 2006 132,000
Richfield, Wisconsin September 2006 166,000
La Vista, Nebraska October 2006 129,000
Hazelwood, Missouri April 2007 132,000
Hoffman Estates, Illinois September 2007 182,000
East Hartford, Connecticut October 2007 182,000
Gonzales, Louisiana October 2007 167,000
Hammond, Indiana October 2007 189,000
Reno, Nevada November 2007 129,000
Post Falls, Idaho November 2007 129,000
Lacey, Washington November 2007 182,000
Scarborough, Maine May 2008 129,000
Rapid City, South Dakota August 2008 80,000
Billings, Montana May 2009 80,000
Grand Junction, Colorado May 2010 76,000
Allen, Texas April 2011 107,000
Springfield, Oregon May 2011 70,000
4,568,000
Canada:
Winnipeg, Manitoba September 2007 44,000
Edmonton, Alberta August 2011 70,000
114,000
Total retail square footage 4,682,000
At December 31, 2011, the total net book value of our property and equipment was $867 million. At the end of
2011, we believe that our properties and equipment were suitable for their intended use.