Cabela's 2011 Annual Report Download - page 46
Download and view the complete annual report
Please find page 46 of the 2011 Cabela's annual report below. You can navigate through the pages in the report by either clicking on the pages listed below, or by using the keyword search tool below to find specific information within the annual report.-
 1
1 -
2
-
3
-
4
-
5
-
6
-
7
-
8
-
9
-
10
-
11
-
12
-
13
-
14
-
15
-
16
-
17
-
18
-
19
-
20
-
21
-
22
-
23
-
24
-
25
-
26
-
27
-
28
-
29
-
30
-
31
-
32
-
33
-
34
-
35
-
 36
36 -
 37
37 -
 38
38 -
 39
39 -
 40
40 -
 41
41 -
 42
42 -
 43
43 -
 44
44 -
 45
45 -
 46
46 -
 47
47 -
 48
48 -
 49
49 -
 50
50 -
 51
51 -
 52
52 -
 53
53 -
 54
54 -
 55
55 -
 56
56 -
57
-
58
-
59
-
60
-
61
-
62
-
63
-
64
-
65
-
66
-
67
-
68
-
69
-
70
-
71
-
72
-
73
-
74
-
75
-
76
-
77
-
78
-
79
-
80
-
81
-
82
-
83
-
84
-
85
-
86
-
87
-
88
-
89
-
90
-
91
-
92
-
93
-
94
-
95
-
96
-
97
-
98
-
99
-
100
-
101
-
102
-
103
-
104
-
105
-
106
-
107
-
108
-
109
-
110
-
111
-
112
-
113
-
114
-
115
-
116
-
117
-
118
-
119
-
120
-
121
-
122
-
123
-
124
-
125
-
126
-
127
-
128
-
129
-
130
-
131
-
132
 |
 |

36
Impact of Change in Accounting Principles in 2010 – The accounting guidance on consolidations and
accounting for transfers of financial assets and the criteria for determining whether to consolidate a variable
interest entity resulted in the consolidation of the Trust effective January 3, 2010, which resulted in an increase in
total assets and liabilities of $2.15 billion and $2.25 billion, respectively, and a decrease in retained earnings and
other comprehensive income of $93 million, after tax. In 2010, we began reporting the results of operations of our
Financial Services business in a manner similar to our historical managed presentation for financial performance
of the total managed portfolio of credit card loans, excluding income derived from the changes in the valuation of
our interest-only strip, cash reserve accounts, and cash accounts associated with the securitized loans.
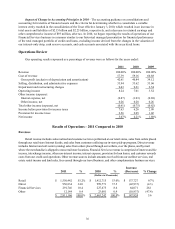
Operations Review
Our operating results expressed as a percentage of revenue were as follows for the years ended:
2011 2010 2009
Revenue 100.00% 100.00% 100.00%
Cost of revenue 57.39 59.16 60.88
Gross profit (exclusive of depreciation and amortization) 42.61 40.84 39.12
Selling, distribution, and administrative expenses 33.94 33.62 33.06
Impairment and restructuring charges 0.43 0.21 2.54
Operating income 8.24 7.01 3.52
Other income (expense):
Interest expense, net (0.87) (1.03) (0.88)
Other income, net 0.26 0.28 0.26
Total other income (expense), net (0.61) (0.75) (0.62)
Income before provision for income taxes 7.63 6.26 2.90
Provision for income taxes 2.56 2.05 1.02
Net income 5.07% 4.21% 1.88%
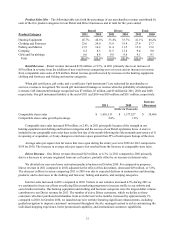
Results of Operations - 2011 Compared to 2010
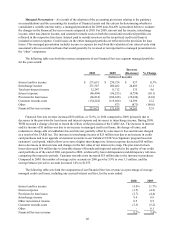
Revenues
Retail revenue includes sales realized and customer services performed at our retail stores, sales from orders placed
through our retail store Internet kiosks, and sales from customers utilizing our in-store pick-up program. Direct revenue
includes Internet and call center (catalog) sales from orders placed through our website, over the phone, and by mail
where the merchandise is shipped to non-retail store locations. Financial Services revenue is comprised of interest and fee
income, interchange income, other non-interest income, interest expense, provision for loan losses, and customer rewards
costs from our credit card operations. Other revenue sources include amounts received from our outfitter services, real
estate rental income and land sales, fees earned through our travel business, and other complementary business services.
2011 %2010 %
Increase
(Decrease) % Change
(Dollars in Thousands)
Retail $ 1,550,442 55.2% $ 1,412,715 53.0% $ 137,727 9.7%
Direct 956,834 34.0 999,771 37.5 (42,937) (4.3)
Financial Services 291,746 10.4 227,675 8.6 64,071 28.1
Other 12,144 0.4 23,081 0.9 (10,937) (47.4)
$ 2,811,166 100.0% $ 2,663,242 100.0% $ 147,924 5.6