Cabela's 2011 Annual Report Download - page 52
Download and view the complete annual report
Please find page 52 of the 2011 Cabela's annual report below. You can navigate through the pages in the report by either clicking on the pages listed below, or by using the keyword search tool below to find specific information within the annual report.-
 1
1 -
2
-
3
-
4
-
5
-
6
-
7
-
8
-
9
-
10
-
11
-
12
-
13
-
14
-
15
-
16
-
17
-
18
-
19
-
20
-
21
-
22
-
23
-
24
-
25
-
26
-
27
-
28
-
29
-
30
-
31
-
32
-
33
-
34
-
35
-
36
-
37
-
38
-
39
-
40
-
41
-
 42
42 -
 43
43 -
 44
44 -
 45
45 -
 46
46 -
 47
47 -
 48
48 -
 49
49 -
 50
50 -
 51
51 -
 52
52 -
 53
53 -
 54
54 -
 55
55 -
 56
56 -
 57
57 -
 58
58 -
 59
59 -
 60
60 -
 61
61 -
 62
62 -
63
-
64
-
65
-
66
-
67
-
68
-
69
-
70
-
71
-
72
-
73
-
74
-
75
-
76
-
77
-
78
-
79
-
80
-
81
-
82
-
83
-
84
-
85
-
86
-
87
-
88
-
89
-
90
-
91
-
92
-
93
-
94
-
95
-
96
-
97
-
98
-
99
-
100
-
101
-
102
-
103
-
104
-
105
-
106
-
107
-
108
-
109
-
110
-
111
-
112
-
113
-
114
-
115
-
116
-
117
-
118
-
119
-
120
-
121
-
122
-
123
-
124
-
125
-
126
-
127
-
128
-
129
-
130
-
131
-
132
 |
 |

42
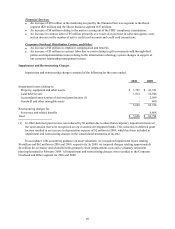
Our long-lived assets are evaluated for possible impairment whenever changes in circumstances may indicate
that the carrying value of an asset may not be recoverable. In 2011 and 2010, we evaluated the recoverability of
our property (including our existing store locations and future retail store sites), equipment, land held for sale,
economic development bonds, other assets, goodwill, and other intangible assets. In accordance with accounting
guidance on asset valuations, we recognized impairment losses totaling $11 million and $6 million in 2011 and
2010, respectively. Trends and management projections could change undiscounted cash flows in future periods
which could trigger possible future write downs.
In 2011, we incurred charges approximating $1 million for severance and related benefits. All impairment and
restructuring charges were recorded to the Corporate Overhead and Other segment for 2011 and 2010.
Important factors we consider that could result in an impairment review are underperformance of the asset
compared to historical or planned operations, significant changes in the utilization of the asset, or changes related
to our strategic plans. An impairment loss is recognized when the estimated undiscounted cash flows expected to
result from the use of the asset plus any expected proceeds from the disposition of the asset, if any, are less than
its carrying value. When an impairment loss is recognized, the carrying amount of the asset is recorded to its
estimated fair value based on independent outside market prices or other valuation techniques.
In 2011, 2010, and 2009, we evaluated the recovery of certain economic development bonds. In 2011 and
2009, we determined that the fair value of the bonds was below carrying value, with the decline in fair value
deemed to be other than temporary, which resulted in fair value adjustments totaling $24 million and $8 million
at the end of 2011 and 2009, respectively. These fair value adjustments of $24 million and $8 million reduced the
carrying value of the economic development bond portfolio at the end of 2011 and 2009, respectively, and resulted
in corresponding reductions in deferred grant income. These reductions in deferred grant income resulted in
increases in depreciation expense of $7 million and $2 million in 2011 and 2009, respectively, which have been
included in impairment and restructuring charges in the consolidated statements of income. At the end of 2010,
none of the bonds with a fair value below carrying value were deemed to have other than a temporary impairment.
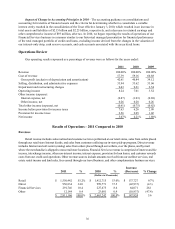
Operating Income
Operating income is revenue less cost of revenue, selling, distribution, and administrative expenses, and
impairment and restructuring charges. Operating income for our merchandise business segments excludes costs
associated with operating expenses of distribution centers, procurement activities, and other corporate overhead
costs.
2011 2010
Increase
(Decrease) % Change
(Dollars in Thousands)
Total operating income $ 231,548 $ 186,762 $ 44,786 24.0%
Total operating income as a percentage
of total revenue 8.2% 7.0% 1.2%
Operating income by business segment:
Retail $ 263,010 $ 205,768 $ 57,242 27.8
Direct 172,163 156,255 15,908 10.2
Financial Services 59,032 52,401 6,631 12.7
Operating income as a percentage
of segment revenue:
Retail 17.0% 14.6% 2.4%
Direct 18.0 15.6 2.4
Financial Services 20.2 23.0 (2.8)