Cabela's 2011 Annual Report Download - page 81
Download and view the complete annual report
Please find page 81 of the 2011 Cabela's annual report below. You can navigate through the pages in the report by either clicking on the pages listed below, or by using the keyword search tool below to find specific information within the annual report.-
 1
1 -
2
-
3
-
4
-
5
-
6
-
7
-
8
-
9
-
10
-
11
-
12
-
13
-
14
-
15
-
16
-
17
-
18
-
19
-
20
-
21
-
22
-
23
-
24
-
25
-
26
-
27
-
28
-
29
-
30
-
31
-
32
-
33
-
34
-
35
-
36
-
37
-
38
-
39
-
40
-
41
-
42
-
43
-
44
-
45
-
46
-
47
-
48
-
49
-
50
-
51
-
52
-
53
-
54
-
55
-
56
-
57
-
58
-
59
-
60
-
61
-
62
-
63
-
64
-
65
-
66
-
67
-
68
-
69
-
70
-
 71
71 -
 72
72 -
 73
73 -
 74
74 -
 75
75 -
 76
76 -
 77
77 -
 78
78 -
 79
79 -
 80
80 -
 81
81 -
 82
82 -
 83
83 -
 84
84 -
 85
85 -
 86
86 -
 87
87 -
 88
88 -
 89
89 -
 90
90 -
 91
91 -
92
-
93
-
94
-
95
-
96
-
97
-
98
-
99
-
100
-
101
-
102
-
103
-
104
-
105
-
106
-
107
-
108
-
109
-
110
-
111
-
112
-
113
-
114
-
115
-
116
-
117
-
118
-
119
-
120
-
121
-
122
-
123
-
124
-
125
-
126
-
127
-
128
-
129
-
130
-
131
-
132
 |
 |

71
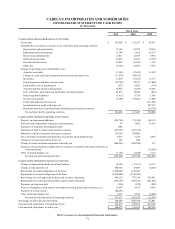
CABELA’S INCORPORATED AND SUBSIDIARIES
CONSOLIDATED STATEMENTS OF CASH FLOWS
(In Thousands)
Fiscal Years
2011 2010 2009
CASH FLOWS FROM OPERATING ACTIVITIES:
Net income $ 142,620 $ 112,159 $ 49,617
Adjustments to reconcile net income to net cash flows from operating activities:
Depreciation and amortization 71,343 69,872 70,566
Impairment and restructuring 11,309 5,626 62,237
Stock-based compensation 12,911 11,198 9,410
Deferred income taxes 35,073 19,407 (9,927)
Provision for loan losses 39,287 66,814 1,107
Other, net (3,722) (2,081) 3,555
Change in operating assets and liabilities, net:
Accounts receivable (1,265) (17,623) 11,599
Change in credit card loans originated from internal operations, net (17,276) (49,415) -
Inventories 14,270 (73,217) 71,773
Prepaid expenses and other current assets (22,759) 24,121 (17,009)
Land held for sale or development (227) 8,032 (339)
Accounts payable and accrued expenses 70,952 (1,629) 33,418
Gift certificates, and credit card and loyalty rewards programs 24,873 18,626 (828)
Other long-term liabilities (5,412) 9,738 1,306
Income taxes payable (5,509) (34,201) 17,408
Credit card loans held for sale, net - - (177,461)
Securitizations of credit card loans, net - - 207,312
Retained interests in securitized loans (including asset-backed securities) - - (39,724)
Net cash provided by operating activities 366,468 167,427 294,020
CASH FLOWS FROM INVESTING ACTIVITIES:
Property and equipment additions (126,740) (75,349) (49,113)
Proceeds from dispositions of property and equipment 47 3,025 11,914
Purchases of economic development bonds (601) - -
Purchases of held-to-maturity investment securities (197,999) (349,738) -
Maturities of held-to-maturity investment securities 197,999 350,000 -
Proceeds from retirements and maturities of economic development bonds 3,057 7,214 2,654
Change in restricted cash of the Trust, net 242 846 -
Change in credit card loans originated externally, net (406,863) (280,924) 333
Purchases of asset-backed available-for-sale securities classified with retained interests in
securitized loans - - (76,924)
Other investing changes, net (1,182) (2,644) 5,113
Net cash used in investing activities (532,040) (347,570) (106,023)
CASH FLOWS FROM FINANCING ACTIVITIES:
Change in unpresented checks net of bank balance (8,103) (17,167) 16,177
Change in time deposits, net 469,562 36,088 (8,225)
Borrowings on secured obligations of the Trust 2,238,000 1,110,500 -
Repayments on secured obligations of the Trust (2,359,400) (1,399,500) -
Borrowings on revolving credit facilities and inventory financing 646,132 477,514 626,091
Repayments on revolving credit facilities and inventory financing (646,189) (483,335) (651,992)
Payments on long-term debt (230) (225) (289)
Exercise of employee stock options and employee stock purchase plan issuances, net 12,869 8,168 4,346
Purchase of treasury stock (20,287) - -
Other financing changes, net 1,478 2,334 (2,024)
Net cash provided by (used in) financing activities 333,832 (265,623) (15,916)
Net change in cash and cash equivalents 168,260 (445,766) 172,081
Cash and cash equivalents, at beginning of year 136,419 582,185 410,104
Cash and cash equivalents, at end of year $ 304,679 $ 136,419 $ 582,185
Refer to notes to consolidated financial statements.