Cabela's 2011 Annual Report Download - page 47
Download and view the complete annual report
Please find page 47 of the 2011 Cabela's annual report below. You can navigate through the pages in the report by either clicking on the pages listed below, or by using the keyword search tool below to find specific information within the annual report.-
 1
1 -
2
-
3
-
4
-
5
-
6
-
7
-
8
-
9
-
10
-
11
-
12
-
13
-
14
-
15
-
16
-
17
-
18
-
19
-
20
-
21
-
22
-
23
-
24
-
25
-
26
-
27
-
28
-
29
-
30
-
31
-
32
-
33
-
34
-
35
-
36
-
 37
37 -
 38
38 -
 39
39 -
 40
40 -
 41
41 -
 42
42 -
 43
43 -
 44
44 -
 45
45 -
 46
46 -
 47
47 -
 48
48 -
 49
49 -
 50
50 -
 51
51 -
 52
52 -
 53
53 -
 54
54 -
 55
55 -
 56
56 -
 57
57 -
58
-
59
-
60
-
61
-
62
-
63
-
64
-
65
-
66
-
67
-
68
-
69
-
70
-
71
-
72
-
73
-
74
-
75
-
76
-
77
-
78
-
79
-
80
-
81
-
82
-
83
-
84
-
85
-
86
-
87
-
88
-
89
-
90
-
91
-
92
-
93
-
94
-
95
-
96
-
97
-
98
-
99
-
100
-
101
-
102
-
103
-
104
-
105
-
106
-
107
-
108
-
109
-
110
-
111
-
112
-
113
-
114
-
115
-
116
-
117
-
118
-
119
-
120
-
121
-
122
-
123
-
124
-
125
-
126
-
127
-
128
-
129
-
130
-
131
-
132
 |
 |

37
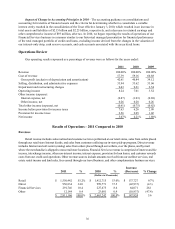
Product Sales Mix – The following table sets forth the percentage of our merchandise revenue contributed by
each of the five product categories for our Retail and Direct businesses and in total for the years ended:
Retail Direct Total
Product Category 2011 2010 2011 2010 2011 2010
Hunting Equipment 45.7% 44.5% 33.4% 33.7% 41.1% 40.2%
Clothing and Footwear 23.6 24.0 33.9 33.4 27.4 27.7
Fishing and Marine 13.9 14.2 11.4 11.5 13.0 13.2
Camping 8.2 8.5 11.5 11.8 9.4 9.8
Gifts and Furnishings 8.6 8.8 9.8 9.6 9.1 9.1
Tot al 100.0% 100.0% 100.0% 100.0% 100.0% 100.0%
Retail Revenue – Retail revenue increased $138 million, or 9.7%, in 2011 primarily due to an increase of
$93 million in revenue from the addition of new retail stores comparing year over year and an increase in revenue
from comparable store sales of $39 million. Retail revenue growth was led by increases in the hunting equipment,
clothing and footwear, and fishing and marine categories.
When gift certificates, gift cards, and e-certificates (“gift instruments”) are redeemed for merchandise or
services, revenue is recognized. We record gift instrument breakage as revenue when the probability of redemption
is remote. Gift instrument breakage recognized was $7 million, $5 million, and $5 million for 2011, 2010, and 2009,
respectively. Our gift instrument liability at the end of 2011 and 2010 was $118 million and $111 million, respectively.
2011 2010
Increase
(Decrease)
(Dollars in Thousands)
Comparable stores sales $ 1,416,133 $ 1,377,527 $ 38,606
Comparable stores sales growth percentage 2.8% 1.6%
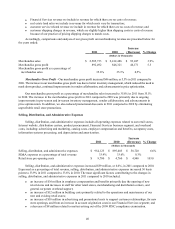
Comparable store sales increased $39 million, or 2.8%, in 2011 principally because of the strength in our
hunting equipment and clothing and footwear categories and the success of our Retail operations focus. A store is
included in our comparable store sales base on the first day of the month following the fifteen month anniversary of 1)
its opening or acquisition, or 2) any changes to retail store space greater than 25% of total square footage of the store.
Average sales per square foot for stores that were open during the entire year were $328 for 2011 compared to
$314 for 2010. The increase in average sales per square foot resulted from the increase in comparable store sales.
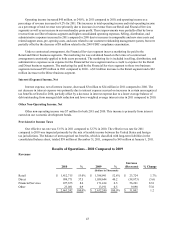
Direct Revenue – Our Direct revenue decreased $43 million, or 4.3%, in 2011 compared to 2010 primarily
due to a decrease in revenue originated from our call centers, partially offset by an increase in Internet sales.
We divested our non-core home restoration products business in October 2010. For comparative purposes,
Direct revenue in 2011 compared to 2010, adjusted for the effect of this divestiture, decreased $29 million, or 3.0%.
The decrease in Direct revenue comparing 2011 to 2010 was due to expected declines in ammunition and shooting
products, and to decreases in the clothing and footwear, fishing and marine, and camping categories.
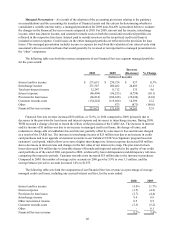
Internet sales increased in 2011 compared to 2010. Visitors to our websites increased 4.5% during 2011 as
we continued to focus our efforts on utilizing Direct marketing programs to increase traffic to our website and
social media networks. Our hunting equipment and clothing and footwear categories were the largest dollar volume
contributor to our Direct revenue for 2011. The number of active Direct customers, which we define as those
customers who have purchased merchandise from us in the last twelve months, increased by approximately 1%
compared to 2010. In October 2010, we launched our new website featuring significant enhancements, including
guided navigation to improve customers’ movement throughout the site, managed content to aid in customizing the
individual shopping experience, better promotional capability, and international commerce capabilities.