Cabela's 2011 Annual Report Download - page 92
Download and view the complete annual report
Please find page 92 of the 2011 Cabela's annual report below. You can navigate through the pages in the report by either clicking on the pages listed below, or by using the keyword search tool below to find specific information within the annual report.-
 1
1 -
2
-
3
-
4
-
5
-
6
-
7
-
8
-
9
-
10
-
11
-
12
-
13
-
14
-
15
-
16
-
17
-
18
-
19
-
20
-
21
-
22
-
23
-
24
-
25
-
26
-
27
-
28
-
29
-
30
-
31
-
32
-
33
-
34
-
35
-
36
-
37
-
38
-
39
-
40
-
41
-
42
-
43
-
44
-
45
-
46
-
47
-
48
-
49
-
50
-
51
-
52
-
53
-
54
-
55
-
56
-
57
-
58
-
59
-
60
-
61
-
62
-
63
-
64
-
65
-
66
-
67
-
68
-
69
-
70
-
71
-
72
-
73
-
74
-
75
-
76
-
77
-
78
-
79
-
80
-
81
-
 82
82 -
 83
83 -
 84
84 -
 85
85 -
 86
86 -
 87
87 -
 88
88 -
 89
89 -
 90
90 -
 91
91 -
 92
92 -
 93
93 -
 94
94 -
 95
95 -
 96
96 -
 97
97 -
 98
98 -
 99
99 -
 100
100 -
 101
101 -
 102
102 -
103
-
104
-
105
-
106
-
107
-
108
-
109
-
110
-
111
-
112
-
113
-
114
-
115
-
116
-
117
-
118
-
119
-
120
-
121
-
122
-
123
-
124
-
125
-
126
-
127
-
128
-
129
-
130
-
131
-
132
 |
 |

82
CABELA’S INCORPORATED AND SUBSIDIARIES
NOTES TO CONSOLIDATED FINANCIAL STATEMENTS
(Dollars in Thousands Except Share and Per Share Amounts)
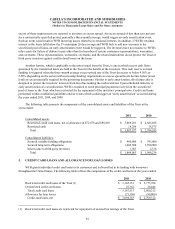
Allowance for Loan Losses:
The following table reflects the activity in the allowance for loan losses by segment for the years ended:
2011 2010
Credit Card
Loans
Restructured
Credit Card
Loans
Tot al
Credit Card
Loans
Tot al
Credit Card
Loans
Balance, beginning of year $ 52,000 $ 38,900 $ 90,900 $ 1,374
Change in allowance for loan losses
upon consolidation of the Trust - - - 114,573
52,000 38,900 90,900 115,947
Provision for loan losses 35,777 3,510 39,287 66,814
Charge-offs (56,616) (18,983) (75,599) (108,111)
Recoveries 13,189 5,573 18,762 16,250
Net charge-offs (43,427) (13,410 ) (56,837) (91,861)
Balance, end of year $ 44,350 $ 29,000 $ 73,350 $ 90,900
Credit Quality Indicators, Delinquent, and Non-Accrual Loans:
WFB segments the loan portfolio into loans that have been restructured and other credit card loans in order to
facilitate the estimation of the losses inherent in the portfolio as of the reporting date. WFB uses the scores of Fair
Isaac Corporation (“FICO”), a widely-used tool for assessing an individual’s credit rating, as the primary credit
quality indicator. The FICO score is an indicator of quality, with the risk of loss increasing as an individual’s FICO
score decreases. The credit card loan segment was disaggregated into the following classes based upon the loan’s
current related FICO score: 679 and below, 680-749, and 750 and above. WFB considers a loan to be delinquent
if the minimum payment is not received by the payment due date. The aging method is based on the number of
completed billing cycles during which a customer has failed to make a required payment.