Cabela's 2011 Annual Report Download - page 49
Download and view the complete annual report
Please find page 49 of the 2011 Cabela's annual report below. You can navigate through the pages in the report by either clicking on the pages listed below, or by using the keyword search tool below to find specific information within the annual report.-
 1
1 -
2
-
3
-
4
-
5
-
6
-
7
-
8
-
9
-
10
-
11
-
12
-
13
-
14
-
15
-
16
-
17
-
18
-
19
-
20
-
21
-
22
-
23
-
24
-
25
-
26
-
27
-
28
-
29
-
30
-
31
-
32
-
33
-
34
-
35
-
36
-
37
-
38
-
 39
39 -
 40
40 -
 41
41 -
 42
42 -
 43
43 -
 44
44 -
 45
45 -
 46
46 -
 47
47 -
 48
48 -
 49
49 -
 50
50 -
 51
51 -
 52
52 -
 53
53 -
 54
54 -
 55
55 -
 56
56 -
 57
57 -
 58
58 -
 59
59 -
60
-
61
-
62
-
63
-
64
-
65
-
66
-
67
-
68
-
69
-
70
-
71
-
72
-
73
-
74
-
75
-
76
-
77
-
78
-
79
-
80
-
81
-
82
-
83
-
84
-
85
-
86
-
87
-
88
-
89
-
90
-
91
-
92
-
93
-
94
-
95
-
96
-
97
-
98
-
99
-
100
-
101
-
102
-
103
-
104
-
105
-
106
-
107
-
108
-
109
-
110
-
111
-
112
-
113
-
114
-
115
-
116
-
117
-
118
-
119
-
120
-
121
-
122
-
123
-
124
-
125
-
126
-
127
-
128
-
129
-
130
-
131
-
132
 |
 |

39
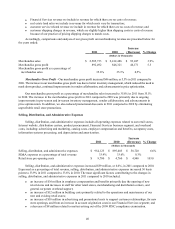
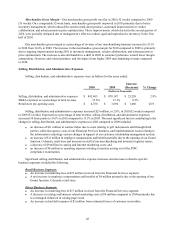
Our Cabela’s CLUB Visa credit card loyalty program allows customers to earn points whenever and wherever
they use their credit card, and then redeem earned points for products and services at our retail stores or through
our Direct business. The percentage of our merchandise sold to customers using the Cabela’s CLUB Visa credit
card approximated 29% for 2011. The dollar amounts related to points are accrued as earned by the cardholder and
recorded as a reduction in Financial Services revenue. The dollar amount of unredeemed credit card points and
loyalty points was $109 million at the end of 2011 compared to $92 million at the end of 2010.
Key statistics reflecting the performance of our Financial Services business are shown in the following chart
for the years ended:
2011 2010
Increase
(Decrease) % Change
(Dollars in Thousands Except Average Balance per Account)
Average balance of credit card loans (1) $ 2,745,118 $ 2,470,493 $ 274,625 11.1%
Average number of active credit card accounts 1,416,887 1,317,890 98,997 7.5
Average balance per active credit card account (1) $ 1,937 $ 1,875 $ 62 3.3
Net charge-offs on credit card loans (1) $ 64,520 $ 104,416 $ (39,896) (38.2)
Net charge-offs as a percentage of average credit
card loans (1) 2.35% 4.23% (1.88)%
(1) Includes accrued interest and fees.
The average balance of credit card loans increased to $2.7 billion, or 11.1%, for 2011 compared to 2010, due
to an increase in the number of active accounts and the average balance per account. The average number of active
accounts increased to 1.4 million, or 7.5%, compared to 2010 due to our marketing efforts. Net charge-offs as a
percentage of average credit card loans decreased to 2.35% for 2011, down 188 basis points compared to 2010, due
to improvements in delinquencies and delinquency roll-rates. See “Bank Asset Quality” in this report for additional
information on trends in delinquencies and non-accrual loans and analysis of our allowance for loan losses.
Other Revenue
2011 2010
Increase
(Decrease) % Change
(Dollars in Thousands)
Other revenue $ 12,144 $ 23,081 $ (10,937) (47.4)%
Other revenue decreased $11 million in 2011 compared to 2010 primarily due to a decrease of $10 million in
real estate sales revenue. After adjusting for the cost of real estate, pre-tax gains on the sale of real estate totaled $2
million in 2010 with no sales in 2011. Pre-tax gains on the sale of real estate are reflected in operating income.
Gross Profit
Gross profit is defined as total revenue less the costs of related merchandise sold and shipping costs.
Comparisons of gross profit and gross profit as a percentage of revenue for our operations, year over year, and to
the retail industry in general, are impacted by:
• shifts in customer preferences;
• retail store, distribution, and warehousing costs (including depreciation and amortization), which we
exclude from our cost of revenue;
• royalty fees we include in merchandise sales for which there are no costs of revenue;