Cabela's 2011 Annual Report Download - page 114
Download and view the complete annual report
Please find page 114 of the 2011 Cabela's annual report below. You can navigate through the pages in the report by either clicking on the pages listed below, or by using the keyword search tool below to find specific information within the annual report.-
 1
1 -
2
-
3
-
4
-
5
-
6
-
7
-
8
-
9
-
10
-
11
-
12
-
13
-
14
-
15
-
16
-
17
-
18
-
19
-
20
-
21
-
22
-
23
-
24
-
25
-
26
-
27
-
28
-
29
-
30
-
31
-
32
-
33
-
34
-
35
-
36
-
37
-
38
-
39
-
40
-
41
-
42
-
43
-
44
-
45
-
46
-
47
-
48
-
49
-
50
-
51
-
52
-
53
-
54
-
55
-
56
-
57
-
58
-
59
-
60
-
61
-
62
-
63
-
64
-
65
-
66
-
67
-
68
-
69
-
70
-
71
-
72
-
73
-
74
-
75
-
76
-
77
-
78
-
79
-
80
-
81
-
82
-
83
-
84
-
85
-
86
-
87
-
88
-
89
-
90
-
91
-
92
-
93
-
94
-
95
-
96
-
97
-
98
-
99
-
100
-
101
-
102
-
103
-
 104
104 -
 105
105 -
 106
106 -
 107
107 -
 108
108 -
 109
109 -
 110
110 -
 111
111 -
 112
112 -
 113
113 -
 114
114 -
 115
115 -
 116
116 -
 117
117 -
 118
118 -
 119
119 -
 120
120 -
 121
121 -
 122
122 -
 123
123 -
 124
124 -
125
-
126
-
127
-
128
-
129
-
130
-
131
-
132
 |
 |

104
CABELA’S INCORPORATED AND SUBSIDIARIES
NOTES TO CONSOLIDATED FINANCIAL STATEMENTS
(Dollars in Thousands Except Share and Per Share Amounts)
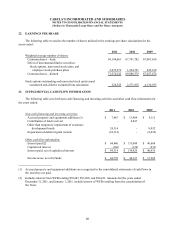
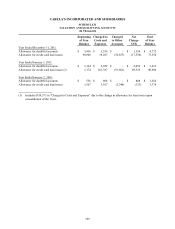
For 2011 and 2010, the components for the Financial Services segment are not comparable to 2009 and
prior year amounts as a result of the consolidation of the Trust as of January 3, 2010. Beginning in 2010, the
securitization income component was no longer recorded and separately reported; rather the remaining components
now reflect the financial performance of the entire managed portfolio which includes the Trust. See Note 3 for
additional information on the consolidation of the Trust. The components and amounts of total revenue for the
Financial Services business segment were as follows for the periods presented.
2011 2010 2009
Interest and fee income $ 277,242 $ 271,651 $ 51,505
Interest expense (70,303) (86,494) (24,242)
Provision for loan losses (39,287) (66,814) (1,107)
Net interest income, net of provision for loan losses 167,652 118,343 26,156
Non-interest income:
Securitization income - - 197,335
Interchange income 267,106 231,347 31,701
Other non-interest income 13,620 12,247 35,888
Total non-interest income 280,726 243,594 264,924
Less: Customer rewards costs (156,632) (134,262) (119,666)
Financial Services revenue $ 291,746 $ 227,675 $ 171,414
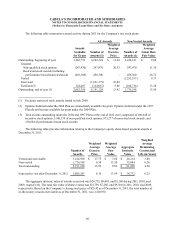
The Company’s products are principally marketed to individuals within the United States. Net sales
generated in other geographic markets, primarily Canada, have collectively been less than 3% of consolidated net
merchandise sales in each year. No single customer accounted for 10% or more of consolidated net sales. No single
product or service accounted for a significant percentage of the Company’s consolidated revenue.
The following table sets forth the percentage of the Company’s merchandise revenue contributed by each of
the five product categories for our Retail and Direct businesses and in total for the years presented:
Retail Direct Total
Product Category 2011 2010 2009 2011 2010 2009 2011 2010 2009
Hunting Equipment 45.7% 44.5% 45.3% 33.4% 33.7% 35.2% 41.1% 40.2% 41.1%
Clothing and Footwear 23.6 24.0 22.9 33.9 33.4 33.4 27.4 27.7 27.3
Fishing and Marine 13.9 14.2 14.5 11.4 11.5 12.1 13.0 13.2 13.5
Camping 8.2 8.5 8.5 11.5 11.8 10.2 9.4 9.8 9.2
Gifts and Furnishings 8.6 8.8 8.8 9.8 9.6 9.1 9.1 9.1 8.9
Tot al 100.0% 100.0% 100.0% 100.0% 100.0% 100.0% 100.0% 100.0% 100.0%
25. FAIR VALUE MEASUREMENTS
Fair value as defined in accounting literature is the price that would be received to sell an asset or paid to
transfer a liability in an orderly transaction between market participants at the measurement date. In determining
fair value, the Company uses various methods including discounted cash flow projections based on available
market interest rates and management estimates of future cash payments. Financial instrument assets and liabilities
measured and reported at fair value are classified and disclosed in one of the following categories:
• Level 1 – Quoted market prices in active markets for identical assets or liabilities.
• Level 2 – Observable inputs other than quoted market prices.
• Level 3 – Unobservable inputs corroborated by little, if any, market data.