Cabela's 2011 Annual Report Download - page 41
Download and view the complete annual report
Please find page 41 of the 2011 Cabela's annual report below. You can navigate through the pages in the report by either clicking on the pages listed below, or by using the keyword search tool below to find specific information within the annual report.-
 1
1 -
2
-
3
-
4
-
5
-
6
-
7
-
8
-
9
-
10
-
11
-
12
-
13
-
14
-
15
-
16
-
17
-
18
-
19
-
20
-
21
-
22
-
23
-
24
-
25
-
26
-
27
-
28
-
29
-
30
-
 31
31 -
 32
32 -
 33
33 -
 34
34 -
 35
35 -
 36
36 -
 37
37 -
 38
38 -
 39
39 -
 40
40 -
 41
41 -
 42
42 -
 43
43 -
 44
44 -
 45
45 -
 46
46 -
 47
47 -
 48
48 -
 49
49 -
 50
50 -
 51
51 -
52
-
53
-
54
-
55
-
56
-
57
-
58
-
59
-
60
-
61
-
62
-
63
-
64
-
65
-
66
-
67
-
68
-
69
-
70
-
71
-
72
-
73
-
74
-
75
-
76
-
77
-
78
-
79
-
80
-
81
-
82
-
83
-
84
-
85
-
86
-
87
-
88
-
89
-
90
-
91
-
92
-
93
-
94
-
95
-
96
-
97
-
98
-
99
-
100
-
101
-
102
-
103
-
104
-
105
-
106
-
107
-
108
-
109
-
110
-
111
-
112
-
113
-
114
-
115
-
116
-
117
-
118
-
119
-
120
-
121
-
122
-
123
-
124
-
125
-
126
-
127
-
128
-
129
-
130
-
131
-
132
 |
 |

31
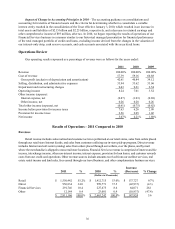
These increases were partially offset by a decrease of $43 million in Direct revenue. Included in Direct
revenue in 2010 was $14 million from our non-core home restoration products business that we divested in
October 2010. Declines in the hunting equipment category, primarily the ammunition and shooting categories, and
the clothing and footwear category, contributed to the remaining decrease in Direct revenue comparing years.
Financial Services revenue increased $64 million, or 28.1%, in 2011 compared to 2010 primarily due to
an increase in interchange income, lower loan losses and interest expense, and growth in the number of active
accounts and average balance per account, partially offset by higher customer reward costs.
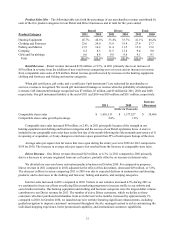
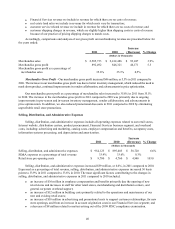
Operating income for 2011 increased $45 million, or 24.0%, compared to 2010, and operating income as a
percentage of revenue increased 120 basis points to 8.2% in 2011 compared to 7.0% in 2010. These increases in
total operating income and total operating income as a percentage of total revenue were primarily due to increases
in revenue from our Retail and Financial Services segments as well as increases in our merchandise gross profit.
These increases were partially offset by lower revenue from our Direct business segment and higher operating
expenses. Selling, distribution, and administrative expenses were higher due to increases in comparable and new
store costs, pre-opening costs, and costs related to supporting our customer relationship management system. We
also had an increase of $7 million in 2011 in impairment and restructuring charges compared to 2010 primarily due
to the impairment of certain economic development bonds and related deferred grant income.
Fiscal 2011 Achievements and Update to Our 2012 Vision - Renewing the Vision
Cabela’s 2012 Vision is to become the best multi-channel outdoor retail company in the world. Even though
the business environment continues to be challenging, we believe our multi-channel model and our strong brand
name provide us with opportunities for growth and profitability. Over our history, we have established name
recognition and a quality brand that is renowned and respected in the outdoor industry. Throughout our multi-
channel business, our strategy is to continue our focus on our customers by providing legendary customer service,
quality, and selection.
In 2011, management confirmed that our strategic initiatives are the key topics to maintain our focus for
improvement and have therefore continued to emphasize these key financial metrics: merchandise gross margin, Retail
segment operating margin, total revenue growth, retail expansion, and growth of our Cabela’s CLUB Visa loyalty
program. Improvements in these metrics have led to an increase in our return on invested capital, an important measure
of how effectively we have deployed capital in our operations in generating cash flows. Increases in our return on invested
capital, on an after-tax basis, indicate improvements in our use of capital, thereby creating value in our Company.
We have six strategic initiatives we are focusing on to achieve our 2012 Vision and thereby generate a higher
after-tax return on invested capital:
• Focus on Core Customers: Combine our outdoor expertise, product knowledge, and understanding
of core customers to drive customer loyalty. Improve customer experiences – every customer, every
interaction, every day. Our goal is to use the product expertise we have developed over the years,
along with a focused understanding of our core customers, to improve customer loyalty, enhance brand
awareness, and offer the best possible assortment of products in every merchandise category.
As we focus on our core customers, we are targeting marketing efforts that are directed to different
customer interests by improving our modeling methodologies. We are also using historic sales information
to select and size markets while focusing on areas with large concentrations of core customers.
We offer our customers integrated opportunities to access and use our retail store, Internet, and catalog
channels. Our in-store pick-up program allows customers to order products through our catalogs, Internet
site, and store kiosks and have them delivered to the retail store of their choice without incurring shipping
costs, thereby helping to increase foot traffic in our stores. Conversely, our expanding retail stores introduce
customers to our Internet and catalog channels. We are capitalizing on our multi-channel model by building
on the strengths of each channel, primarily through improvements in our merchandise planning system.