Cabela's 2011 Annual Report Download - page 50
Download and view the complete annual report
Please find page 50 of the 2011 Cabela's annual report below. You can navigate through the pages in the report by either clicking on the pages listed below, or by using the keyword search tool below to find specific information within the annual report.-
 1
1 -
2
-
3
-
4
-
5
-
6
-
7
-
8
-
9
-
10
-
11
-
12
-
13
-
14
-
15
-
16
-
17
-
18
-
19
-
20
-
21
-
22
-
23
-
24
-
25
-
26
-
27
-
28
-
29
-
30
-
31
-
32
-
33
-
34
-
35
-
36
-
37
-
38
-
39
-
 40
40 -
 41
41 -
 42
42 -
 43
43 -
 44
44 -
 45
45 -
 46
46 -
 47
47 -
 48
48 -
 49
49 -
 50
50 -
 51
51 -
 52
52 -
 53
53 -
 54
54 -
 55
55 -
 56
56 -
 57
57 -
 58
58 -
 59
59 -
 60
60 -
61
-
62
-
63
-
64
-
65
-
66
-
67
-
68
-
69
-
70
-
71
-
72
-
73
-
74
-
75
-
76
-
77
-
78
-
79
-
80
-
81
-
82
-
83
-
84
-
85
-
86
-
87
-
88
-
89
-
90
-
91
-
92
-
93
-
94
-
95
-
96
-
97
-
98
-
99
-
100
-
101
-
102
-
103
-
104
-
105
-
106
-
107
-
108
-
109
-
110
-
111
-
112
-
113
-
114
-
115
-
116
-
117
-
118
-
119
-
120
-
121
-
122
-
123
-
124
-
125
-
126
-
127
-
128
-
129
-
130
-
131
-
132
 |
 |

40
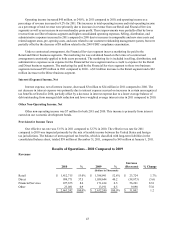
• Financial Services revenue we include in revenue for which there are no costs of revenue;
• real estate land sales we include in revenue for which costs vary by transaction;
• customer service related revenue we include in revenue for which there are no costs of revenue; and
• customer shipping charges in revenue, which are slightly higher than shipping costs in costs of revenue
because of our practice of pricing shipping charges to match costs.
Accordingly, comparisons and analysis of our gross profit on merchandising revenue are presented below for
the years ended:
2011 2010
Increase
(Decrease) % Change
(Dollars in Thousands)
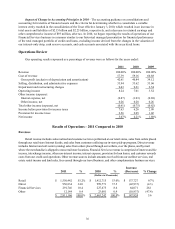
Merchandise sales $ 2,505,733 $ 2,412,486 $ 93,247 3.9%
Merchandise gross profit 892,492 846,321 46,171 5.5
Merchandise gross profit as a percentage of
merchandise sales 35.6% 35.1% 0.5%
Merchandise Gross Profit – Our merchandise gross profit increased $46 million, or 5.5% in 2011 compared to
2010. The increase in our merchandise gross profit was due to better inventory management, which reduced the need to
mark down product, continued improvements in vendor collaboration, and advancements in price optimization.
Our merchandise gross profit as a percentage of merchandise sales increased to 35.6% in 2011 from 35.1%
in 2010. The increase in the merchandise gross profit in 2011 compared to 2010 was primarily due to ongoing
improvements in pre-season and in-season inventory management, vendor collaboration, and advancements in
price optimization. In addition, we also reduced promotional discounts in 2011 compared to 2010 by eliminating
unprofitable retail store promotions.
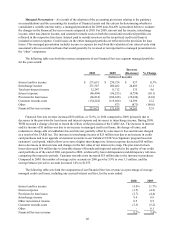
Selling, Distribution, and Administrative Expenses
Selling, distribution, and administrative expenses include all operating expenses related to our retail stores,
Internet website, distribution centers, product procurement, Financial Services business segment, and overhead
costs, including: advertising and marketing, catalog costs, employee compensation and benefits, occupancy costs,
information systems processing, and depreciation and amortization.
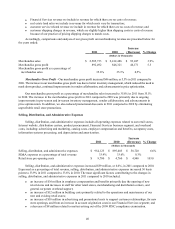
2011 2010
Increase
(Decrease) % Change
(Dollars in Thousands)
Selling, distribution, and administrative expenses $ 954,125 $ 895,405 $ 58,720 6.6%
SD&A expenses as a percentage of total revenue 33.9% 33.6% 0.3%
Retail store pre-opening costs $ 9,700 $ 4,760 $ 4,940 103.8
Selling, distribution, and administrative expenses increased $59 million, or 6.6%, in 2011 compared to 2010.
Expressed as a percentage of total revenue, selling, distribution, and administrative expenses increased 30 basis
points to 33.9% in 2011 compared to 33.6% in 2010. The most significant factors contributing to the changes in
selling, distribution, and administrative expenses in 2011 compared to 2010 included:
• an increase of $36 million in employee compensation and benefits primarily due the opening of new
retail stores and increases in staff for other retail stores, merchandising and distribution centers, and
general corporate overhead support;
• an increase of $12 million in building costs primarily related to the operations and maintenance of our
new and existing retail stores;
• an increase of $10 million in advertising and promotional costs to support customer relationships, for new
store openings, and from an increase in account origination costs in our Financial Services segment; and
• a decrease of $8 million related to matters arising out of the 2009 FDIC compliance examination.