Cabela's 2011 Annual Report Download - page 53
Download and view the complete annual report
Please find page 53 of the 2011 Cabela's annual report below. You can navigate through the pages in the report by either clicking on the pages listed below, or by using the keyword search tool below to find specific information within the annual report.-
 1
1 -
2
-
3
-
4
-
5
-
6
-
7
-
8
-
9
-
10
-
11
-
12
-
13
-
14
-
15
-
16
-
17
-
18
-
19
-
20
-
21
-
22
-
23
-
24
-
25
-
26
-
27
-
28
-
29
-
30
-
31
-
32
-
33
-
34
-
35
-
36
-
37
-
38
-
39
-
40
-
41
-
42
-
 43
43 -
 44
44 -
 45
45 -
 46
46 -
 47
47 -
 48
48 -
 49
49 -
 50
50 -
 51
51 -
 52
52 -
 53
53 -
 54
54 -
 55
55 -
 56
56 -
 57
57 -
 58
58 -
 59
59 -
 60
60 -
 61
61 -
 62
62 -
 63
63 -
64
-
65
-
66
-
67
-
68
-
69
-
70
-
71
-
72
-
73
-
74
-
75
-
76
-
77
-
78
-
79
-
80
-
81
-
82
-
83
-
84
-
85
-
86
-
87
-
88
-
89
-
90
-
91
-
92
-
93
-
94
-
95
-
96
-
97
-
98
-
99
-
100
-
101
-
102
-
103
-
104
-
105
-
106
-
107
-
108
-
109
-
110
-
111
-
112
-
113
-
114
-
115
-
116
-
117
-
118
-
119
-
120
-
121
-
122
-
123
-
124
-
125
-
126
-
127
-
128
-
129
-
130
-
131
-
132
 |
 |

43
Operating income increased $45 million, or 24.0%, in 2011 compared to 2010, and operating income as a
percentage of revenue increased to 8.2% for 2011. The increases in total operating income and total operating income
as a percentage of total revenue were primarily due to increases in revenue from our Retail and Financial Services
segments as well as an increase in our merchandise gross profit. These improvements were partially offset by lower
revenue from our Direct business segment and higher consolidated operating expenses. Selling, distribution, and
administrative expenses increased in 2011 compared to 2010 due to increases in comparable and new store costs and
related support areas, pre-opening costs, and costs related to our customer relationship management system, but were
partially offset by the decrease of $8 million related to the 2009 FDIC compliance examination.
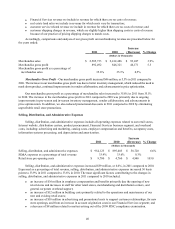
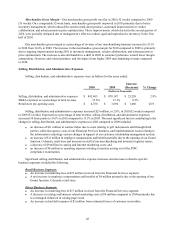
Under a contractual arrangement, the Financial Services segment incurs a marketing fee paid to the
Retail and Direct business segments. The marketing fee was calculated based on the terms of a contractual
arrangement consistently applied to both years presented. The marketing fee is included in selling, distribution, and
administrative expenses as an expense for the Financial Services segment and as a credit to expense for the Retail
and Direct business segments. The marketing fee paid by the Financial Services segment to these two business
segments increased $55 million in 2011 compared to 2010 – a $33 million increase to the Retail segment and a $22
million increase to the Direct business segment.
Interest (Expense) Income, Net
Interest expense, net of interest income, decreased $3 million to $24 million in 2011 compared to 2010. The
net decrease in interest expense was primarily due to interest expense accrued on increases in certain unrecognized
tax benefits reflected in 2010, partially offset by a decrease in interest expense due to a lower average balance of
debt outstanding from managed debt reduction and lower weighted average interest rates in 2011 compared to 2010.
Other Non-Operating Income, Net
Other non-operating income was $7 million for both 2011 and 2010. This income is primarily from interest
earned on our economic development bonds.
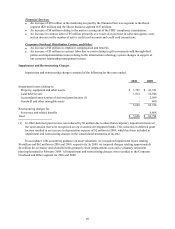
Provision for Income Taxes
Our effective tax rate was 33.5% in 2011 compared to 32.7% in 2010. The effective tax rate for 2011
compared to 2010 was impacted primarily by the mix of taxable income between the United States and foreign
tax jurisdictions. The balance of unrecognized tax benefits, which is classified with long-term liabilities in the
consolidated balance sheet, totaled $38 million at December 31, 2011, compared to $43 million at January 1, 2011.
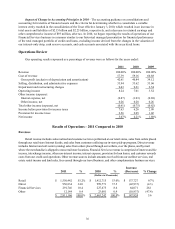
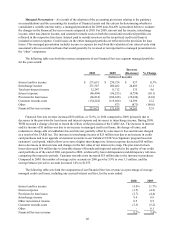
Results of Operations - 2010 Compared to 2009
Revenues
2010 %2009 %
Increase
(Decrease) % Change
(Dollars in Thousands)
Retail $ 1,412,715 53.0% $ 1,388,991 52.8% $ 23,724 1.7%
Direct 999,771 37.5 1,058,644 40.2 (58,873) (5.6)
Financial Services 227,675 8.6 171,414 6.5 56,261 32.8
Other 23,081 0.9 13,191 0.5 9,890 75.0
$ 2,663,242 100.0% $ 2,632,240 100.0% $ 31,002 1.2