Cabela's 2011 Annual Report Download - page 9
Download and view the complete annual report
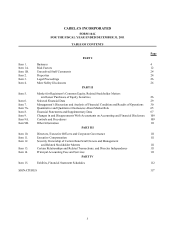
Please find page 9 of the 2011 Cabela's annual report below. You can navigate through the pages in the report by either clicking on the pages listed below, or by using the keyword search tool below to find specific information within the annual report.-
 1
1 -
 2
2 -
 3
3 -
 4
4 -
 5
5 -
 6
6 -
 7
7 -
 8
8 -
 9
9 -
 10
10 -
 11
11 -
 12
12 -
 13
13 -
 14
14 -
 15
15 -
 16
16 -
 17
17 -
 18
18 -
 19
19 -
 20
20 -
21
-
22
-
23
-
24
-
25
-
26
-
27
-
28
-
29
-
30
-
31
-
32
-
33
-
34
-
35
-
36
-
37
-
38
-
39
-
40
-
41
-
42
-
43
-
44
-
45
-
46
-
47
-
48
-
49
-
50
-
51
-
52
-
53
-
54
-
55
-
56
-
57
-
58
-
59
-
60
-
61
-
62
-
63
-
64
-
65
-
66
-
67
-
68
-
69
-
70
-
71
-
72
-
73
-
74
-
75
-
76
-
77
-
78
-
79
-
80
-
81
-
82
-
83
-
84
-
85
-
86
-
87
-
88
-
89
-
90
-
91
-
92
-
93
-
94
-
95
-
96
-
97
-
98
-
99
-
100
-
101
-
102
-
103
-
104
-
105
-
106
-
107
-
108
-
109
-
110
-
111
-
112
-
113
-
114
-
115
-
116
-
117
-
118
-
119
-
120
-
121
-
122
-
123
-
124
-
125
-
126
-
127
-
128
-
129
-
130
-
131
-
132
 |
 |

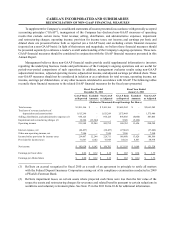
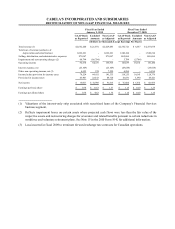
CABELA’S INCORPORATED AND SUBSIDIARIES
RETURN ON INVESTED CAPITAL
Return on invested capital (“ROIC”) is not a measure of financial performance under generally accepted
accounting principles (“GAAP”) and may not be defined and calculated by other companies in the same manner.
ROIC should be considered supplemental to and not a substitute for financial information prepared in accordance
with GAAP. The Company uses ROIC as a measure of efficiency and effectiveness of its use of capital.
The Company measures ROIC by dividing adjusted net income by average total capital. Adjusted net income
is calculated by adding interest expense, rent expense, and Retail segment depreciation and amortization (all after
tax) to reported net income excluding: (1) any losses on sales of assets, (2) any impairment charges or fixed asset
writedowns, and (3) any acceleration of depreciation charges caused by impairment of economic development bonds
(all after tax). Total capital is calculated by adding current maturities of long-term debt, deferred compensation,
operating leases capitalized at eight times next year’s annual minimum lease payments, and total stockholders’
equity to long-term debt (excluding all debt of World’s Foremost Bank (“WFB”)) and then subtracting cash and cash
equivalents (excluding cash and cash equivalents of WFB). Average total capital is calculated as the sum of current
and prior year ending total capital divided by two. The following table reconciles the components of ROIC to the most
comparable GAAP financial measures.
Fiscal Year Ended
December 31, 2011 January 1, 2011 January 2, 2010 December 27, 2008
(Dollars in Thousands)
Net income $ 142,620 $112,159 $49,617 $76,404
Add back:
Interest expense 24,454 27,482 23,223 29,708
Rent expense 9,541 7,506 8,624 8,494
Depreciation and amortization - Retail segment 41,506 40,011 41,822 37,930
Exclude:
Losses on sales of assets - - - -
Impairment charges or fixed asset writedowns 4,771 5,626 60,227 3,694
Acceleration of depreciation charges from
impairment of economic development bonds 6,538 -2,099 516
86,810 80,625 135,995 80,342
After tax effect 57,729 54,253 88,179 51,917
Effective tax rate 33.50%32.71%35.16%35.38%
Adjusted net income $ 200,349 $166,412 $137,796 $128,321
Total capital:
Current maturities of long-term debt $ 8,387 $230 $3,101 $695
Deferred compensation - 291 349 5,192
Operating leases capitalized at 8x next year’s
annual minimum lease payments 85,968 55,864 53,608 44,928
Total stockholders’ equity 1,181,316 1,024,548 984,421 913,705
Long-term debt (excluding WFB debt) 336,535 344,922 345,178 379,336
1,612,206 1,425,855 1,386,657 1,343,856
Less:
Cash and cash equivalents (304,679)(136,419)(582,185)(410,104)
Add back cash and cash equivalents at WFB 117,035 81,904 371,408 402,058
(187,644)(54,515)(210,777)(8,046)
Adjusted total capital $ 1,424,562 $1,371,340 $1,175,880 $1,335,810
Average total capital $1,397,951 $1,273,610 $1,255,845 $ 1,353,061
Return on Invested Capital 14. 3%13.1%11.0%9.5%