Cabela's 2011 Annual Report Download - page 56
Download and view the complete annual report
Please find page 56 of the 2011 Cabela's annual report below. You can navigate through the pages in the report by either clicking on the pages listed below, or by using the keyword search tool below to find specific information within the annual report.-
 1
1 -
2
-
3
-
4
-
5
-
6
-
7
-
8
-
9
-
10
-
11
-
12
-
13
-
14
-
15
-
16
-
17
-
18
-
19
-
20
-
21
-
22
-
23
-
24
-
25
-
26
-
27
-
28
-
29
-
30
-
31
-
32
-
33
-
34
-
35
-
36
-
37
-
38
-
39
-
40
-
41
-
42
-
43
-
44
-
45
-
 46
46 -
 47
47 -
 48
48 -
 49
49 -
 50
50 -
 51
51 -
 52
52 -
 53
53 -
 54
54 -
 55
55 -
 56
56 -
 57
57 -
 58
58 -
 59
59 -
 60
60 -
 61
61 -
 62
62 -
 63
63 -
 64
64 -
 65
65 -
 66
66 -
67
-
68
-
69
-
70
-
71
-
72
-
73
-
74
-
75
-
76
-
77
-
78
-
79
-
80
-
81
-
82
-
83
-
84
-
85
-
86
-
87
-
88
-
89
-
90
-
91
-
92
-
93
-
94
-
95
-
96
-
97
-
98
-
99
-
100
-
101
-
102
-
103
-
104
-
105
-
106
-
107
-
108
-
109
-
110
-
111
-
112
-
113
-
114
-
115
-
116
-
117
-
118
-
119
-
120
-
121
-
122
-
123
-
124
-
125
-
126
-
127
-
128
-
129
-
130
-
131
-
132
 |
 |

46
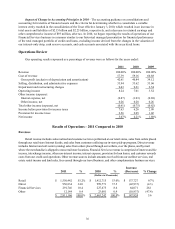
Managed Presentation – As a result of the adoption of the accounting provisions relating to the guidance
on consolidations and the accounting for transfers of financial assets and the criteria for determining whether to
consolidate a variable interest entity, a managed presentation for 2009 (non-GAAP) is presented below to evaluate
the changes in the Financial Services revenue compared to 2010. For 2009, interest and fee income, interchange
income, other non-interest income, and customer rewards costs on both the owned and securitized portfolio are
reflected in the respective line items. Interest paid to outside investors on the securitized credit card loans is
included in interest expense. Credit losses on the entire managed portfolio are reflected in the provision for loan
losses. This managed presentation includes income or expense derived from the valuation of our interest-only strip
associated with our securitized loans that would generally be reversed or not reported in a managed presentation in
the “other” component.
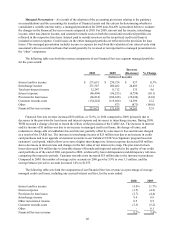
The following table sets forth the revenue components of our Financial Services segment managed portfolio
for the years ended:
2010 2009
Increase
(Decrease) % Change
(Dollars in Thousands)
Interest and fee income $ 271,651 $ 270,724 $ 927 0.3%
Interchange income 231,347 206,462 24,885 12.1
Total non-interest income 12,247 11,712 535 4.6
Interest expense (86,494) (96,253) (9,759) (10.1)
Provision for loan losses (66,814) (102,438) (35,624) (34.8)
Customer rewards costs (134,262) (119,666) 14,596 12.2
Other - 873 (873) (100.0)
Financial Services revenue $ 227,675 $ 171,414 $ 56,261 32.8
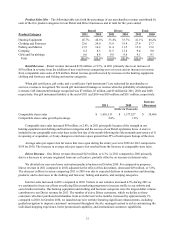
Financial Services revenue increased $56 million, or 32.8%, in 2010 compared to 2009, primarily due to
decreases in the provision for loan losses and interest expense and increases in interchange income. During 2009,
WFB executed a change of terms to lessen the effects of the provisions of the CARD Act. The increase in interest
and fee income of $1 million was due to an increase in managed credit card loans, the change of terms, and
reduction in charge-offs of cardholder fees and interest, partially offset by a decrease in fees and interest charged
as a result of the CARD Act. The increase in interchange income of $25 million was due to an increase in credit
card purchases and to an upgrade of customer accounts to our Cabela’s CLUB Visa Signature program based on
customers’ card spend, which allows us to earn a higher interchange rate. Interest expense decreased $10 million
due to decreases in interest rates and changes in the fair value of our interest rate swap. The provision for loan
losses decreased $36 million due to favorable charge-off trends and improved outlooks in the quality of our credit
card portfolio as of the end of 2010 compared to 2009, evidenced by lower delinquencies and delinquency roll-rates
comparing the respective periods. Customer rewards costs increased $15 million due to the increase in purchases.
Compared to 2009, the number of average active accounts in 2010 grew by 5.9% to over 1.3 million, and the
average balance per active account increased 1.0% to $1,875.
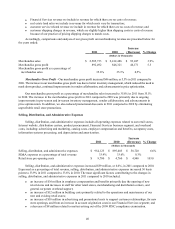
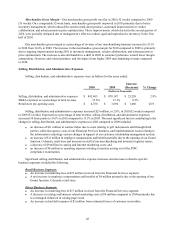
The following table sets forth the components of our Financial Services revenue as a percentage of average
managed credit card loans, including any accrued interest and fees, for the years ended:
2010 2009
Interest and fee income 11.0% 11.7%
Interest expense (3.5) (4.2)
Provision for loan losses (2.7) (4.4)
Interchange income 9.4 8.9
Other non-interest income 0.5 0.5
Customer rewards costs (5.5) (5.2)
Other - 0.1
Financial Services revenue 9.2% 7.4%