Cabela's 2011 Annual Report Download - page 38
Download and view the complete annual report
Please find page 38 of the 2011 Cabela's annual report below. You can navigate through the pages in the report by either clicking on the pages listed below, or by using the keyword search tool below to find specific information within the annual report.-
 1
1 -
2
-
3
-
4
-
5
-
6
-
7
-
8
-
9
-
10
-
11
-
12
-
13
-
14
-
15
-
16
-
17
-
18
-
19
-
20
-
21
-
22
-
23
-
24
-
25
-
26
-
27
-
 28
28 -
 29
29 -
 30
30 -
 31
31 -
 32
32 -
 33
33 -
 34
34 -
 35
35 -
 36
36 -
 37
37 -
 38
38 -
 39
39 -
 40
40 -
 41
41 -
 42
42 -
 43
43 -
 44
44 -
 45
45 -
 46
46 -
 47
47 -
 48
48 -
49
-
50
-
51
-
52
-
53
-
54
-
55
-
56
-
57
-
58
-
59
-
60
-
61
-
62
-
63
-
64
-
65
-
66
-
67
-
68
-
69
-
70
-
71
-
72
-
73
-
74
-
75
-
76
-
77
-
78
-
79
-
80
-
81
-
82
-
83
-
84
-
85
-
86
-
87
-
88
-
89
-
90
-
91
-
92
-
93
-
94
-
95
-
96
-
97
-
98
-
99
-
100
-
101
-
102
-
103
-
104
-
105
-
106
-
107
-
108
-
109
-
110
-
111
-
112
-
113
-
114
-
115
-
116
-
117
-
118
-
119
-
120
-
121
-
122
-
123
-
124
-
125
-
126
-
127
-
128
-
129
-
130
-
131
-
132
 |
 |
28
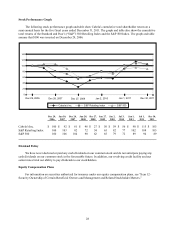
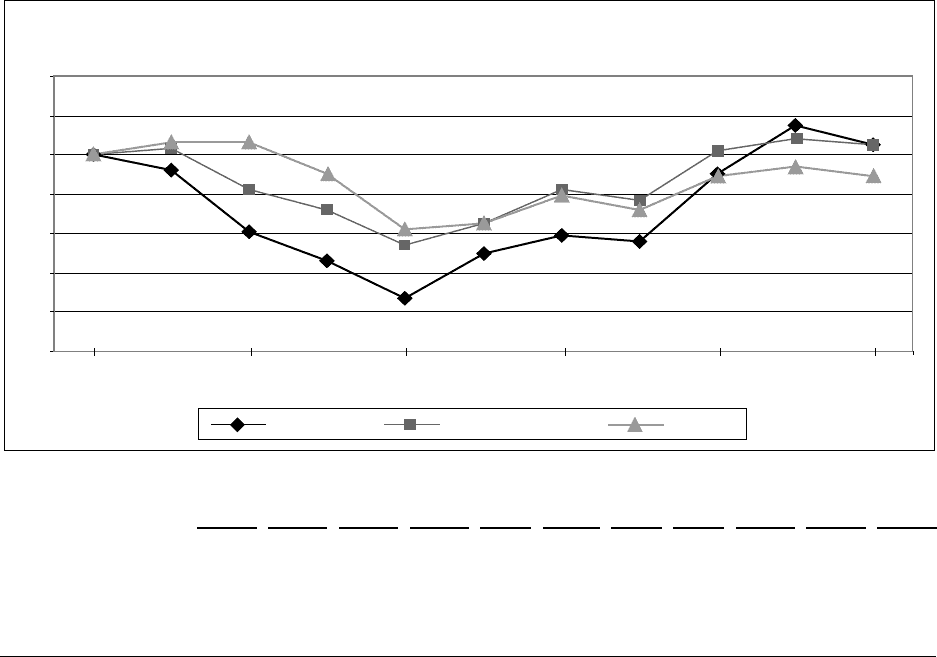
Stock Performance Graph
The following stock performance graph and table show Cabela’s cumulative total shareholder return on a
semi-annual basis for the five fiscal years ended December 31, 2011. The graph and table also show the cumulative
total returns of the Standard and Poor’s (“S&P”) 500 Retailing Index and the S&P 500 Index. The graph and table
assume that $100 was invested on December 29, 2006.
0
20
40
60
80
100
120
140
Cabela’s Inc. S&P Retailing Index S&P 500
Dec 29, 2006 Dec 28, 2007 Dec 27, 2008 Jan 2, 2010 Jan 1, 2011 Dec 30, 2011
Dec 29,
2006
Jun 30,
2007
Dec 28,
2007
Jun 28,
2008
Dec 27,
2008
Jun 27,
2009
Jan 2,
2010
Jul 3,
2010
Jan 1,
2011
Jul 1,
2011
Dec 30,
2011
Cabela’s Inc. $ 100 $ 92 $ 61 $ 46 $ 27 $ 50 $ 59 $ 56 $ 90 $ 115 $ 105
S&P Retailing Index 100 103 82 72 54 65 82 77 102 108 105
S&P 500 100 106 104 90 62 65 79 72 89 94 89
Dividend Policy
We have never declared or paid any cash dividends on our common stock and do not anticipate paying any
cash dividends on our common stock in the foreseeable future. In addition, our revolving credit facility and our
senior notes limit our ability to pay dividends to our stockholders.
Equity Compensation Plans
For information on securities authorized for issuance under our equity compensation plans, see “Item 12 -
Security Ownership of Certain Beneficial Owners and Management and Related Stockholder Matters.”