Cabela's 2011 Annual Report Download - page 60
Download and view the complete annual report
Please find page 60 of the 2011 Cabela's annual report below. You can navigate through the pages in the report by either clicking on the pages listed below, or by using the keyword search tool below to find specific information within the annual report.-
 1
1 -
2
-
3
-
4
-
5
-
6
-
7
-
8
-
9
-
10
-
11
-
12
-
13
-
14
-
15
-
16
-
17
-
18
-
19
-
20
-
21
-
22
-
23
-
24
-
25
-
26
-
27
-
28
-
29
-
30
-
31
-
32
-
33
-
34
-
35
-
36
-
37
-
38
-
39
-
40
-
41
-
42
-
43
-
44
-
45
-
46
-
47
-
48
-
49
-
 50
50 -
 51
51 -
 52
52 -
 53
53 -
 54
54 -
 55
55 -
 56
56 -
 57
57 -
 58
58 -
 59
59 -
 60
60 -
 61
61 -
 62
62 -
 63
63 -
 64
64 -
 65
65 -
 66
66 -
 67
67 -
 68
68 -
 69
69 -
 70
70 -
71
-
72
-
73
-
74
-
75
-
76
-
77
-
78
-
79
-
80
-
81
-
82
-
83
-
84
-
85
-
86
-
87
-
88
-
89
-
90
-
91
-
92
-
93
-
94
-
95
-
96
-
97
-
98
-
99
-
100
-
101
-
102
-
103
-
104
-
105
-
106
-
107
-
108
-
109
-
110
-
111
-
112
-
113
-
114
-
115
-
116
-
117
-
118
-
119
-
120
-
121
-
122
-
123
-
124
-
125
-
126
-
127
-
128
-
129
-
130
-
131
-
132
 |
 |

50
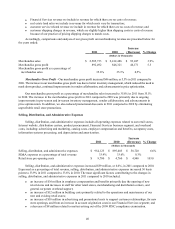
Operating Income
Operating income comparisons were as follows for the years ended:
2010 2009
Increase
(Decrease) % Change
(Dollars in Thousands)
Total operating income $ 186,762 $ 92,678 $ 94,084 101.5%
Total operating income as a percentage
of total revenue 7.0% 3.5% 3.5%
Operating income by business segment:
Retail $ 205,768 $ 163,018 $ 42,750 26.2
Direct 156,255 161,052 (4,797) (3.0)
Financial Services 52,401 49,598 2,803 5.7
Operating income as a percentage
of segment revenue:
Retail 14.6% 11.7% 2.9%
Direct 15.6 15.2 0.4
Financial Services 23.0 28.9 (5.9)
Operating income increased $94 million, or 101.5%, in 2010 compared to 2009, and operating income as
a percentage of revenue increased to 7.0% for 2010. The increases in total operating income and total operating
income as a percentage of total revenue were primarily due to a decrease of $61 million in impairment and
restructuring charges compared to 2009, an increase in revenue from our Retail and Financial Services segments,
improved merchandise gross margin, a decrease in direct marketing costs due to a managed reduction in catalog
page count, and improved labor efficiencies in our Retail business. These improvements were partially offset by
lower revenue from our Direct business segment.
The marketing fee paid by the Financial Services segment to the Retail and Direct business segments was
included in selling, distribution, and administrative expenses as an expense for the Financial Services segment and
as a credit to expense for the Retail and Direct business segments. The marketing fee paid by the Financial Services
segment to these two business segments increased $38 million in 2010 compared to 2009 – a $21 million increase
to the Retail segment and a $17 million increase to the Direct business segment.
Interest (Expense) Income, Net
Interest expense, net of interest income, increased $4 million to $27 million in 2010 compared to 2009. The
net increase in interest expense was primarily due to interest expense accrued on increases in certain unrecognized
tax benefits reflected in 2010, partially offset by a decrease in interest expense due to a lower average balance of
debt outstanding from managed debt reduction and lower weighted average interest rates in 2010 compared to 2009.
Other Non-Operating Income, Net
Other non-operating income was $7 million for both 2010 and 2009. This income is primarily from interest
earned on our economic development bonds.
Provision for Income Taxes
Our effective tax rate was 32.7% in 2010 compared to 35.2% in 2009. The effective tax rate for 2010
compared to 2009 was impacted primarily by the mix of taxable income between the United States and foreign
tax jurisdictions and by changes made in 2010 related to certain deferred tax assets. The balance of unrecognized