Cabela's 2011 Annual Report Download - page 40
Download and view the complete annual report
Please find page 40 of the 2011 Cabela's annual report below. You can navigate through the pages in the report by either clicking on the pages listed below, or by using the keyword search tool below to find specific information within the annual report.-
 1
1 -
2
-
3
-
4
-
5
-
6
-
7
-
8
-
9
-
10
-
11
-
12
-
13
-
14
-
15
-
16
-
17
-
18
-
19
-
20
-
21
-
22
-
23
-
24
-
25
-
26
-
27
-
28
-
29
-
 30
30 -
 31
31 -
 32
32 -
 33
33 -
 34
34 -
 35
35 -
 36
36 -
 37
37 -
 38
38 -
 39
39 -
 40
40 -
 41
41 -
 42
42 -
 43
43 -
 44
44 -
 45
45 -
 46
46 -
 47
47 -
 48
48 -
 49
49 -
 50
50 -
51
-
52
-
53
-
54
-
55
-
56
-
57
-
58
-
59
-
60
-
61
-
62
-
63
-
64
-
65
-
66
-
67
-
68
-
69
-
70
-
71
-
72
-
73
-
74
-
75
-
76
-
77
-
78
-
79
-
80
-
81
-
82
-
83
-
84
-
85
-
86
-
87
-
88
-
89
-
90
-
91
-
92
-
93
-
94
-
95
-
96
-
97
-
98
-
99
-
100
-
101
-
102
-
103
-
104
-
105
-
106
-
107
-
108
-
109
-
110
-
111
-
112
-
113
-
114
-
115
-
116
-
117
-
118
-
119
-
120
-
121
-
122
-
123
-
124
-
125
-
126
-
127
-
128
-
129
-
130
-
131
-
132
 |
 |

30
ITEM 7. MANAGEMENT’S DISCUSSION AND ANALYSIS OF FINANCIAL CONDITION AND
RESULTS OF OPERATIONS
The following discussion and analysis of financial condition, results of operations, liquidity, and capital
resources should be read in conjunction with our audited consolidated financial statements and notes thereto
appearing elsewhere in this report.
Forward Looking Statements – Our discussion contains forward-looking statements with respect to our
plans and strategies for our businesses and the business environment that are impacted by risks and uncertainties.
Refer to “Special Note Regarding Forward-Looking Statements” preceding PART I, ITEM 1, and to ITEM 1A
“Risk Factors” for information regarding certain of the risks and uncertainties that affect our business and the
industries in which we operate. Please note that our actual results may differ materially from those we may
estimate or project in any of these forward-looking statements.
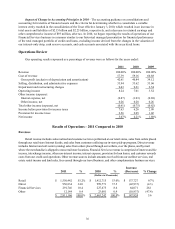
Cabela’s®
We are a leading specialty retailer, and the world’s largest direct marketer, of hunting, fishing, camping, and
related outdoor merchandise. We provide a quality service to our customers who enjoy an outdoor lifestyle by
supplying outdoor products through our multi-channel retail business consisting of our Retail and Direct business
segments. Our Retail business segment consists of 34 stores, including three new stores that opened in 2011: Allen,
Texas, on April 14th, Springfield, Oregon, on May 5th, and Edmonton, Alberta, Canada, on August 4th. We now have
32 stores located in the United States and two in Canada with total retail square footage of 4.7 million square feet
at the end of 2011. Our Direct business segment is comprised of our highly acclaimed Internet website which is
supplemented by our catalog distributions as a selling and marketing tool.
Our Financial Services business segment also plays an integral role in supporting our merchandising
business. Our Financial Services business segment is comprised of our credit card services, which reinforces our
strong brand and strengthens our customer loyalty through our credit card loyalty programs.
Fiscal 2011 Executive Overview
2011 2010
Increase
(Decrease) % Change
(Dollars in Thousands Except Earnings Per Diluted Share)
Revenue:
Retail $ 1,550,442 $ 1,412,715 $ 137,727 9.7%
Direct 956,834 999,771 (42,937) (4.3)
Total merchandise sales 2,507,276 2,412,486 94,790 3.9
Financial Services 291,746 227,675 64,071 28.1
Other revenue 12,144 23,081 (10,937) (47.4)
Total revenue $ 2,811,166 $ 2,663,242 $ 147,924 5.6
Operating income $ 231,548 $ 186,762 $ 44,786 24.0
Earnings per diluted share $ 2.00 $ 1.62 $ 0.38 23.5
Revenues for 2011 totaled $2.8 billion, an increase of $148 million, or 5.6%, over 2010. Total merchandise
sales increased $95 million, or 3.9%, in 2011 compared to 2010. The net increase in total merchandise sales
comparing 2011 to 2010 was primarily due to:
• a net increase of $93 million in revenue from new retail stores, and
• an increase of $39 million, or 2.8%, in comparable store sales, led by increases in sales in the hunting
equipment category.