Cabela's 2011 Annual Report Download - page 57
Download and view the complete annual report
Please find page 57 of the 2011 Cabela's annual report below. You can navigate through the pages in the report by either clicking on the pages listed below, or by using the keyword search tool below to find specific information within the annual report.-
 1
1 -
2
-
3
-
4
-
5
-
6
-
7
-
8
-
9
-
10
-
11
-
12
-
13
-
14
-
15
-
16
-
17
-
18
-
19
-
20
-
21
-
22
-
23
-
24
-
25
-
26
-
27
-
28
-
29
-
30
-
31
-
32
-
33
-
34
-
35
-
36
-
37
-
38
-
39
-
40
-
41
-
42
-
43
-
44
-
45
-
46
-
 47
47 -
 48
48 -
 49
49 -
 50
50 -
 51
51 -
 52
52 -
 53
53 -
 54
54 -
 55
55 -
 56
56 -
 57
57 -
 58
58 -
 59
59 -
 60
60 -
 61
61 -
 62
62 -
 63
63 -
 64
64 -
 65
65 -
 66
66 -
 67
67 -
68
-
69
-
70
-
71
-
72
-
73
-
74
-
75
-
76
-
77
-
78
-
79
-
80
-
81
-
82
-
83
-
84
-
85
-
86
-
87
-
88
-
89
-
90
-
91
-
92
-
93
-
94
-
95
-
96
-
97
-
98
-
99
-
100
-
101
-
102
-
103
-
104
-
105
-
106
-
107
-
108
-
109
-
110
-
111
-
112
-
113
-
114
-
115
-
116
-
117
-
118
-
119
-
120
-
121
-
122
-
123
-
124
-
125
-
126
-
127
-
128
-
129
-
130
-
131
-
132
 |
 |

47
Key statistics reflecting the performance of our Financial Services business are shown in the following chart
for the years ended:
2010 2009
Increase
(Decrease) % Change
(Dollars in Thousands Except Average Balance per Account)
Average balance of managed credit card loans $ 2,470,493 $ 2,311,820 $ 158,673 6.9%
Average number of active credit card accounts 1,317,890 1,244,621 73,269 5.9
Average balance per active credit card account $ 1,875 $ 1,857 $ 18 1.0
Net charge-offs on managed loans, including
accrued interest and fees $ 104,416 $ 117,072 $ (12,656) (10.8)
Net charge-offs, including accrued interest and
fees, as a percentage of average managed
credit card loans 4.23% 5.06% (0.83)%
The average balance of managed credit card loans, including accrued interest and fees, increased to
$2.5 billion, or 6.9%, for 2010 compared to 2009, due to the increase in the number of active accounts and the
average balance per account. The average number of active accounts increased to 1.3 million, or 5.9%, compared
to the average number of active accounts for 2009, due to our marketing efforts. Net charge-offs as a percentage
of average managed credit card loans decreased to 4.23% for 2010, down 83 basis points compared to 2009,
principally due to improvements in delinquencies and delinquency roll-rates.
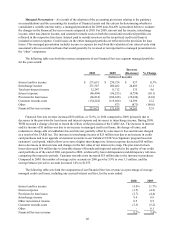
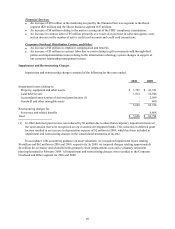
Other Revenue
Other revenue was as follows for the years ended:
2010 2009
Increase
(Decrease) % Change
(Dollars in Thousands)
Other revenue $ 23,081 $ 13,191 $ 9,890 75.0%
Real estate related revenue included above 11,487 2,133 9,354 438.5
Other revenue increased $10 million for 2010 compared to 2009. Real estate revenue totaled $11 million in
2010 compared to $2 million in 2009. Pre-tax gains on the sale of real estate totaled $2 million in both 2010 and
2009. These pre-tax gains on the sale of real estate were reflected in operating income for the respective years.
Gross Profit
Comparisons and analysis of our gross profit on merchandising revenue are presented below for the years ended:
2010 2009
Increase
(Decrease) % Change
(Dollars in Thousands)
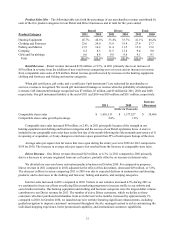
Merchandising revenue $ 2,412,486 $ 2,447,635 $ (35,149) (1.4)%
Merchandise gross profit 846,321 846,499 (178) -
Merchandise gross margin as a percentage of
merchandising revenue 35.1% 34.6% 0.5%