Cabela's 2011 Annual Report Download - page 113
Download and view the complete annual report
Please find page 113 of the 2011 Cabela's annual report below. You can navigate through the pages in the report by either clicking on the pages listed below, or by using the keyword search tool below to find specific information within the annual report.-
 1
1 -
2
-
3
-
4
-
5
-
6
-
7
-
8
-
9
-
10
-
11
-
12
-
13
-
14
-
15
-
16
-
17
-
18
-
19
-
20
-
21
-
22
-
23
-
24
-
25
-
26
-
27
-
28
-
29
-
30
-
31
-
32
-
33
-
34
-
35
-
36
-
37
-
38
-
39
-
40
-
41
-
42
-
43
-
44
-
45
-
46
-
47
-
48
-
49
-
50
-
51
-
52
-
53
-
54
-
55
-
56
-
57
-
58
-
59
-
60
-
61
-
62
-
63
-
64
-
65
-
66
-
67
-
68
-
69
-
70
-
71
-
72
-
73
-
74
-
75
-
76
-
77
-
78
-
79
-
80
-
81
-
82
-
83
-
84
-
85
-
86
-
87
-
88
-
89
-
90
-
91
-
92
-
93
-
94
-
95
-
96
-
97
-
98
-
99
-
100
-
101
-
102
-
 103
103 -
 104
104 -
 105
105 -
 106
106 -
 107
107 -
 108
108 -
 109
109 -
 110
110 -
 111
111 -
 112
112 -
 113
113 -
 114
114 -
 115
115 -
 116
116 -
 117
117 -
 118
118 -
 119
119 -
 120
120 -
 121
121 -
 122
122 -
 123
123 -
124
-
125
-
126
-
127
-
128
-
129
-
130
-
131
-
132
 |
 |

103
CABELA’S INCORPORATED AND SUBSIDIARIES
NOTES TO CONSOLIDATED FINANCIAL STATEMENTS
(Dollars in Thousands Except Share and Per Share Amounts)
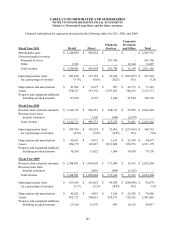
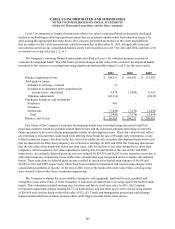
Financial information by segment is presented in the following tables for 2011, 2010, and 2009:
Fiscal Year 2011 Retail Direct
Financial
Services
Corporate
Overhead
and Other Tot al
Merchandise sales $ 1,548,899 $ 956,834 $ - $ - $ 2,505,733
Non-merchandise revenue:
Financial Services - - 291,746 - 291,746
Other 1,543 - - 12,144 13,687
Total revenue $ 1,550,442 $ 956,834 $ 291,746 $ 12,144 $ 2,811,166
Operating income (loss) $ 263,010 $ 172,163 $ 59,032 $ (262,657) $ 231,548
As a percentage of revenue 17.0% 18.0% 20.2% N/A 8.2%
Depreciation and amortization $ 41,506 $ 6,677 $ 987 $ 22,173 $ 71,343
Assets 878,557 153,758 3,353,263 748,193 5,133,771
Property and equipment additions
including accrued amounts 87,670 6,335 5,640 21,094 120,739
Fiscal Year 2010
Revenue from external customers $ 1,412,715 $ 996,451 $ 228,121 $ 25,955 $ 2,663,242
Revenue (loss) from
internal customers - 3,320 (446) (2,874) -
Total revenue $ 1,412,715 $ 999,771 $ 227,675 $ 23,081 $ 2,663,242
Operating income (loss) $ 205,768 $ 156,255 $ 52,401 $ (227,662) $ 186,762
As a percentage of revenue 14.6% 15.6% 23.0% N/A 7.0%
Depreciation and amortization $ 40,011 $ 4,972 $ 1,141 $ 23,748 $ 69,872
Assets 854,179 110,815 2,911,609 654,576 4,531,179
Property and equipment additions
including accrued amounts 36,206 11,022 1,566 30,926 79,720
Fiscal Year 2009
Revenue from external customers $ 1,388,991 $ 1,054,626 $ 171,880 $ 16,743 $ 2,632,240
Revenue (loss) from
internal customers - 4,018 (466) (3,552) -
Total revenue $ 1,388,991 $ 1,058,644 $ 171,414 $ 13,191 $ 2,632,240
Operating income (loss) $ 163,018 $ 161,052 $ 49,598 $ (280,990) $ 92,678
As a percentage of revenue 11.7% 15.2% 28.9% N/A 3.5%
Depreciation and amortization $ 41,822 $ 5,053 $ 1,186 $ 22,505 $ 70,566
Assets 852,721 100,051 810,571 728,542 2,491,885
Property and equipment additions
including accrued amounts 21,180 11,678 441 16,518 49,817