Cabela's 2011 Annual Report Download - page 82
Download and view the complete annual report
Please find page 82 of the 2011 Cabela's annual report below. You can navigate through the pages in the report by either clicking on the pages listed below, or by using the keyword search tool below to find specific information within the annual report.-
 1
1 -
2
-
3
-
4
-
5
-
6
-
7
-
8
-
9
-
10
-
11
-
12
-
13
-
14
-
15
-
16
-
17
-
18
-
19
-
20
-
21
-
22
-
23
-
24
-
25
-
26
-
27
-
28
-
29
-
30
-
31
-
32
-
33
-
34
-
35
-
36
-
37
-
38
-
39
-
40
-
41
-
42
-
43
-
44
-
45
-
46
-
47
-
48
-
49
-
50
-
51
-
52
-
53
-
54
-
55
-
56
-
57
-
58
-
59
-
60
-
61
-
62
-
63
-
64
-
65
-
66
-
67
-
68
-
69
-
70
-
71
-
 72
72 -
 73
73 -
 74
74 -
 75
75 -
 76
76 -
 77
77 -
 78
78 -
 79
79 -
 80
80 -
 81
81 -
 82
82 -
 83
83 -
 84
84 -
 85
85 -
 86
86 -
 87
87 -
 88
88 -
 89
89 -
 90
90 -
 91
91 -
 92
92 -
93
-
94
-
95
-
96
-
97
-
98
-
99
-
100
-
101
-
102
-
103
-
104
-
105
-
106
-
107
-
108
-
109
-
110
-
111
-
112
-
113
-
114
-
115
-
116
-
117
-
118
-
119
-
120
-
121
-
122
-
123
-
124
-
125
-
126
-
127
-
128
-
129
-
130
-
131
-
132
 |
 |

72
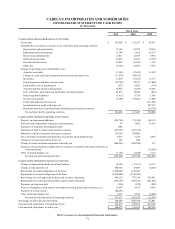
CABELA’S INCORPORATED AND SUBSIDIARIES
CONSOLIDATED STATEMENTS OF STOCKHOLDERS’ EQUITY
(Dollars in Thousands)
Common
Stock
Shares
Common
Stock
Additional
Paid-In
Capital
Retained
Earnings
Accumulated
Other
Comprehensive
Income (Loss)
Treasury
Stock Tot al
BALANCE, beginning of 2009 66,833,984 $ 668 $ 271,958 $ 647,676 $ (6,597) $ - $ 913,705
Comprehensive income:
Net income - - - 49,617 - - 49,617
Unrealized gain on economic development
bonds, net of taxes of $2,487 - - - - 4,104 - 4,104
Unrealized gain on asset-backed available-for-
sale securities, net of taxes of $2,071 - - - - 3,650 - 3,650
Derivative adjustment, net of taxes of $(7) - - - - (11) - (11)
Foreign currency translation adjustment - - - - (181) - (181)
Total comprehensive income 57,179
Stock-based compensation - - 9,057 - - - 9,057
Employee stock purchase plan issuances 217,707 3 2,250 - - - 2,253
Exercise of employee stock options 235,884 2 2,091 - - - 2,093
Tax benefit on employee stock option exercises - - 134 - - - 134
BALANCE, end of 2009 67,287,575 673 285,490 697,293 965 - 984,421
Effect of adopting ASC Topics 810 and 860, net
of tax - - - (89,158) (3,650) - (92,808)
Comprehensive income:
Net income - - - 112,159 - - 112,159
Unrealized loss on economic development
bonds, net of taxes of $(390) - - - - (694) - (694)
Derivative adjustment, net of taxes of $2 - - - - 10 - 10
Foreign currency translation adjustment - - - - 793 - 793
Total comprehensive income 112,268
Stock-based compensation - - 10,879 - - - 10,879
Employee stock purchase plan issuances 130,034 1 2,220 - - - 2,221
Exercise of employee stock options 738,545 7 5,940 - - - 5,947
Tax benefit on employee stock option exercises - - 1,620 - - - 1,620
BALANCE, end of 2010 68,156,154 681 306,149 720,294 (2,576) - 1,024,548
Comprehensive income:
Net income - - - 142,620 - - 142,620
Unrealized gain on economic development
bonds, net of taxes of $3,225 - - - - 5,865 - 5,865
Derivative adjustment, net of taxes of $(89) - - - - (170) - (170)
Foreign currency translation adjustment - - - - (388) - (388)
Total comprehensive income 147,927
Common stock repurchased - - - - - (20,287) (20,287)
Stock-based compensation - - 12,484 - - - 12,484
Exercise of employee stock options and tax
withholdings on share-based payment awards 1,485,664 15 12,854 - - 337 13,206
Tax benefit on employee stock option exercises - - 3,438 - - - 3,438
BALANCE, end of 2011 69,641,818 $ 696 $ 334,925 $ 862,914 $ 2,731 $ (19,950) $ 1,181,316
Refer to notes to consolidated financial statements.