Cabela's 2011 Annual Report Download - page 115
Download and view the complete annual report
Please find page 115 of the 2011 Cabela's annual report below. You can navigate through the pages in the report by either clicking on the pages listed below, or by using the keyword search tool below to find specific information within the annual report.-
 1
1 -
2
-
3
-
4
-
5
-
6
-
7
-
8
-
9
-
10
-
11
-
12
-
13
-
14
-
15
-
16
-
17
-
18
-
19
-
20
-
21
-
22
-
23
-
24
-
25
-
26
-
27
-
28
-
29
-
30
-
31
-
32
-
33
-
34
-
35
-
36
-
37
-
38
-
39
-
40
-
41
-
42
-
43
-
44
-
45
-
46
-
47
-
48
-
49
-
50
-
51
-
52
-
53
-
54
-
55
-
56
-
57
-
58
-
59
-
60
-
61
-
62
-
63
-
64
-
65
-
66
-
67
-
68
-
69
-
70
-
71
-
72
-
73
-
74
-
75
-
76
-
77
-
78
-
79
-
80
-
81
-
82
-
83
-
84
-
85
-
86
-
87
-
88
-
89
-
90
-
91
-
92
-
93
-
94
-
95
-
96
-
97
-
98
-
99
-
100
-
101
-
102
-
103
-
104
-
 105
105 -
 106
106 -
 107
107 -
 108
108 -
 109
109 -
 110
110 -
 111
111 -
 112
112 -
 113
113 -
 114
114 -
 115
115 -
 116
116 -
 117
117 -
 118
118 -
 119
119 -
 120
120 -
 121
121 -
 122
122 -
 123
123 -
 124
124 -
 125
125 -
126
-
127
-
128
-
129
-
130
-
131
-
132
 |
 |

105
CABELA’S INCORPORATED AND SUBSIDIARIES
NOTES TO CONSOLIDATED FINANCIAL STATEMENTS
(Dollars in Thousands Except Share and Per Share Amounts)
Level 3 is comprised of financial instruments whose fair value is estimated based on internally developed
models or methodologies utilizing significant inputs that are primarily unobservable from objective sources. In
determining the appropriate hierarchy levels, the Company performed an analysis of the assets and liabilities
that are subject to fair value measurements and determined that at December 31, 2011, all applicable financial
instruments carried on our consolidated balance sheets were classified as Level 3 for 2011 and 2010, and there were
no transfers in or out of Levels 1, 2, or 3.
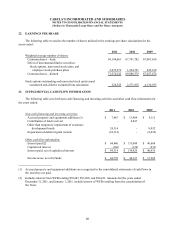
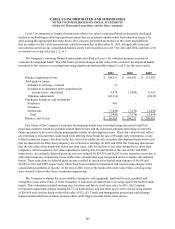
The Company’s recurring financial instruments classified as Level 3 for valuation purposes consists of
economic development bonds. The table below presents changes in fair value of the economic development bonds
measured at fair value on a recurring basis using significant unobservable inputs (Level 3) for the years ended:
2011 2010 2009
Balance, beginning of year $ 104,231 $ 108,491 $ 112,585
Total gains or losses:
Included in earnings - realized 13 - -
Included in accumulated other comprehensive
income (loss) - unrealized 9,078 (1,084) 6,592
Valuation adjustments (24,314) - (8,032)
Purchases, issuances, and settlements:
Purchases 601 - -
Issuances ---
Settlements (3,046) (3,176) (2,654)
Tot al (2,445) (3,176) (2,654)
Balance, end of year $ 86,563 $ 104,231 $ 108,491
Fair values of the Company’s economic development bonds were estimated using discounted cash flow
projection estimates based on available market interest rates and the estimated amounts and timing of expected
future payments to be received from municipalities under tax development zones. These fair values do not reflect
any premium or discount that could result from offering these bonds for sale or through early redemption, or any
related income tax impact. Declines in the fair value of available-for-sale economic development bonds below cost
that are deemed to be other than temporary are reflected in earnings. In 2011 and 2009, the Company determined
that the fair value of the bonds was below carrying value, with the decline in fair value deemed to be other than
temporary, which resulted in fair value adjustments totaling $24,314 and $8,032 at the end of 2011 and 2009,
respectively. Accordingly, deferred grant income was reduced by $24,314 and $8,032 for the respective years due to
other than temporary impairment losses of the same amounts that were recognized on the economic development
bonds. These reductions in deferred grant income resulted in increases in depreciation expense of $6,538 and
$2,099 in 2011 and 2009, respectively, which have been included in impairment and restructuring charges in the
consolidated statements of income. At the end of 2010, none of the bonds with a fair value below carrying value
were deemed to have other than a temporary impairment.
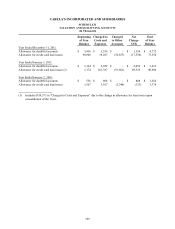
The Company evaluates the recoverability of property and equipment, land held for sale, goodwill and
intangibles on an annual basis or more frequently if indicators of impairment exist using significant unobservable
inputs. This evaluation included existing store locations and future retail store sites. In 2011, the Company
recognized impairment charges totaling $4,771 as land held for sale and other assets with a net carrying amount
of $36,954 were written down to their fair value of $32,183. Trends and management projections could change
undiscounted cash flows in future periods which could trigger possible future write downs.