Cabela's 2011 Annual Report Download - page 55
Download and view the complete annual report
Please find page 55 of the 2011 Cabela's annual report below. You can navigate through the pages in the report by either clicking on the pages listed below, or by using the keyword search tool below to find specific information within the annual report.-
 1
1 -
2
-
3
-
4
-
5
-
6
-
7
-
8
-
9
-
10
-
11
-
12
-
13
-
14
-
15
-
16
-
17
-
18
-
19
-
20
-
21
-
22
-
23
-
24
-
25
-
26
-
27
-
28
-
29
-
30
-
31
-
32
-
33
-
34
-
35
-
36
-
37
-
38
-
39
-
40
-
41
-
42
-
43
-
44
-
 45
45 -
 46
46 -
 47
47 -
 48
48 -
 49
49 -
 50
50 -
 51
51 -
 52
52 -
 53
53 -
 54
54 -
 55
55 -
 56
56 -
 57
57 -
 58
58 -
 59
59 -
 60
60 -
 61
61 -
 62
62 -
 63
63 -
 64
64 -
 65
65 -
66
-
67
-
68
-
69
-
70
-
71
-
72
-
73
-
74
-
75
-
76
-
77
-
78
-
79
-
80
-
81
-
82
-
83
-
84
-
85
-
86
-
87
-
88
-
89
-
90
-
91
-
92
-
93
-
94
-
95
-
96
-
97
-
98
-
99
-
100
-
101
-
102
-
103
-
104
-
105
-
106
-
107
-
108
-
109
-
110
-
111
-
112
-
113
-
114
-
115
-
116
-
117
-
118
-
119
-
120
-
121
-
122
-
123
-
124
-
125
-
126
-
127
-
128
-
129
-
130
-
131
-
132
 |
 |

45
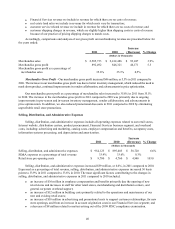
Decreases in Direct revenue were partially mitigated by managed reductions in catalog-related costs
comparing 2010 to 2009. As a percentage of Direct revenue, direct marketing costs decreased 10 basis points to
13.7% for 2010 compared to 13.8% for 2009. As a result of our focus on smaller, more specialized catalogs, we
reduced the number of catalog pages mailed but increased total circulation, leading to continued improvements in
marketing costs compared to 2009.
2010 2009
Increase
(Decrease) % Change
Percentage increase year over year in Internet website visitors 5.8% 17.2%
Catalog circulation in pages (in millions) 24,621 25,927 (1,306) (5.0)%
Number of separate catalog titles circulated 107 97 10
Internet sales increased in 2010 compared to 2009. Visitors to our Internet site increased as we continued to
focus our efforts on utilizing Direct marketing programs to increase traffic to our website. Visitors to our Internet
site increased 5.8% during 2010. Our hunting equipment and clothing and footwear categories were the largest
dollar volume contributor to our Direct revenue for 2010. The number of active Direct customers, which we define
as those customers who have purchased merchandise from us in the last twelve months, increased by approximately
1% compared to 2009.
In October 2010, we launched our new website featuring significant enhancements, including guided
navigation to improve customers’ movement throughout the site, managed content to aid in customizing the
individual shopping experience, better promotional capability, and international commerce capabilities.
In October 2010, we implemented substantial information technology system changes in support of our
customer relationship management system in our Direct business and redesigned our Internet website. During
implementation, we encountered issues with these system changes that affected our ability to take and process
customer orders and to deliver products to our customers in an efficient manner. These implementation issues had
an adverse impact on our business, including the loss of sales. At the end of 2010, we successfully resolved most
customer related issues arising from these system changes.
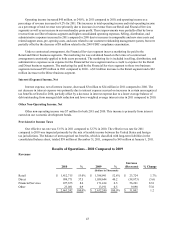
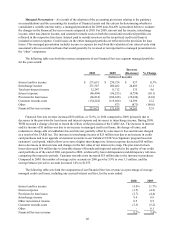
Financial Services Revenue – For 2010, Financial Services revenue is comprised of interest and fee income,
interchange income, other non-interest income, interest expense, provision for loan losses, and customer rewards
costs from our credit card operations. The components of Financial Services revenue for 2010 are not comparable
to the 2009 amounts as we did not retrospectively adopt the accounting provisions relating to the consolidation of
the Trust. Beginning in 2010, the securitization income component was no longer recorded and separately reported;
therefore, the remaining components of Financial Services revenue now reflect the financial performance of the
entire portfolio including the Trust.
The following table sets forth the components of our Financial Services revenue on a generally accepted
accounting principles (“GAAP”) basis for the years ended:
2010 2009
(In Thousands)
Interest and fee income $ 271,651 $ 51,505
Interest expense (86,494) (24,242)
Provision for loan losses (66,814) (1,107)
Net interest income, net of provision for loan losses 118,343 26,156
Non-interest income:
Securitization income - 197,335
Interchange income 231,347 31,701
Other non-interest income 12,247 35,888
Total non-interest income 243,594 264,924
Less: Customer rewards costs (134,262) (119,666)
Financial Services revenue $ 227,675 $ 171,414