Cabela's 2011 Annual Report Download - page 67
Download and view the complete annual report
Please find page 67 of the 2011 Cabela's annual report below. You can navigate through the pages in the report by either clicking on the pages listed below, or by using the keyword search tool below to find specific information within the annual report.-
 1
1 -
2
-
3
-
4
-
5
-
6
-
7
-
8
-
9
-
10
-
11
-
12
-
13
-
14
-
15
-
16
-
17
-
18
-
19
-
20
-
21
-
22
-
23
-
24
-
25
-
26
-
27
-
28
-
29
-
30
-
31
-
32
-
33
-
34
-
35
-
36
-
37
-
38
-
39
-
40
-
41
-
42
-
43
-
44
-
45
-
46
-
47
-
48
-
49
-
50
-
51
-
52
-
53
-
54
-
55
-
56
-
 57
57 -
 58
58 -
 59
59 -
 60
60 -
 61
61 -
 62
62 -
 63
63 -
 64
64 -
 65
65 -
 66
66 -
 67
67 -
 68
68 -
 69
69 -
 70
70 -
 71
71 -
 72
72 -
 73
73 -
 74
74 -
 75
75 -
 76
76 -
 77
77 -
78
-
79
-
80
-
81
-
82
-
83
-
84
-
85
-
86
-
87
-
88
-
89
-
90
-
91
-
92
-
93
-
94
-
95
-
96
-
97
-
98
-
99
-
100
-
101
-
102
-
103
-
104
-
105
-
106
-
107
-
108
-
109
-
110
-
111
-
112
-
113
-
114
-
115
-
116
-
117
-
118
-
119
-
120
-
121
-
122
-
123
-
124
-
125
-
126
-
127
-
128
-
129
-
130
-
131
-
132
 |
 |

57
The following table presents the growth of our retail stores, and the activity of economic development bonds
related to the construction of these stores and related projects, for the years ended:
2011 2010
(Dollars in Thousands)
Property and equipment additions $ 126,740 $ 75,349
Proceeds from retirements and maturities of economic development bonds 3,057 7,214
Number of new retail stores opened during the year 3 1
Number of retail stores at the end of the year 34 31
Retail square footage at the end of the year 4,682,000 4,409,000
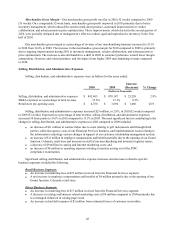
Financing Activities – Cash provided by financing activities improved $599 million in 2011 compared to 2010.
This net change was primarily due to an increase in time deposits, which WFB utilizes to fund its credit card operations,
of $470 million in 2011, compared to $36 million in 2010. Also, net borrowings on secured obligations of the Trust
by WFB increased $168 million. At the end of 2011 and 2010, there were no amounts outstanding on our unsecured
revolving credit facilities. In the fourth quarter of 2011, we repurchased 800,000 shares of our outstanding common
stock in open market transactions at a cost of $20 million. We expect to repurchase our common stock in the future to
offset future equity grants. We expect to fund any repurchases of our common stock with cash from operations.
The following table presents the borrowing activities of our merchandising business and WFB for the
years ended:
2011 2010
(In Thousands)
Borrowings (repayments) on revolving credit facilities and inventory financing, net $ (57) $ (5,821)
Secured borrowings (repayments) of the Trust, net (121,400) (289,000)
Issuances (repayments) of long-term debt, net (230) (225)
Tot al $ (121,687) $ (295,046)
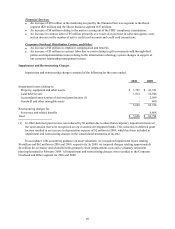
The following table summarizes our availability under the Company’s debt and credit facilities, excluding the
facilities of WFB, at the years ended:
2011 2010
(In Thousands)
Amounts available for borrowing under credit facilities (1) $ 430,000 $ 365,000
Principal amounts outstanding - -
Outstanding letters of credit and standby letters of credit (14,692) (17,579)
Remaining borrowing capacity, excluding WFB facilities $ 415,308 $ 347,421
(1) Consists of our revolving credit facility of $415 million and $15 million CAD from the credit facility for our
operations in Canada.
WFB also has total borrowing availability of $85 million under its agreements to borrow federal funds. At
December 31, 2011, the entire $85 million of borrowing capacity was available to WFB.
Our $415 million unsecured credit agreement requires us to comply with certain financial and other
customary covenants, including:
• a fixed charge coverage ratio (as defined) of no less than 2.00 to 1 as of the last day of any fiscal quarter
for the most recently ended four fiscal quarters (as defined);
• a leverage ratio (as defined) of no more than 3.00 to 1 as of the last day of any fiscal quarter; and
• a minimum consolidated net worth standard (as defined).