Cabela's 2014 Annual Report Download - page 111
Download and view the complete annual report
Please find page 111 of the 2014 Cabela's annual report below. You can navigate through the pages in the report by either clicking on the pages listed below, or by using the keyword search tool below to find specific information within the annual report.-
 1
1 -
2
-
3
-
4
-
5
-
6
-
7
-
8
-
9
-
10
-
11
-
12
-
13
-
14
-
15
-
16
-
17
-
18
-
19
-
20
-
21
-
22
-
23
-
24
-
25
-
26
-
27
-
28
-
29
-
30
-
31
-
32
-
33
-
34
-
35
-
36
-
37
-
38
-
39
-
40
-
41
-
42
-
43
-
44
-
45
-
46
-
47
-
48
-
49
-
50
-
51
-
52
-
53
-
54
-
55
-
56
-
57
-
58
-
59
-
60
-
61
-
62
-
63
-
64
-
65
-
66
-
67
-
68
-
69
-
70
-
71
-
72
-
73
-
74
-
75
-
76
-
77
-
78
-
79
-
80
-
81
-
82
-
83
-
84
-
85
-
86
-
87
-
88
-
89
-
90
-
91
-
92
-
93
-
94
-
95
-
96
-
97
-
98
-
99
-
100
-
 101
101 -
 102
102 -
 103
103 -
 104
104 -
 105
105 -
 106
106 -
 107
107 -
 108
108 -
 109
109 -
 110
110 -
 111
111 -
 112
112 -
 113
113 -
 114
114 -
 115
115 -
 116
116 -
 117
117 -
 118
118 -
 119
119 -
 120
120 -
 121
121 -
122
-
123
-
124
-
125
-
126
-
127
-
128
-
129
-
130
-
131
-
132
 |
 |

101
CABELA’S INCORPORATED AND SUBSIDIARIES
NOTES TO CONSOLIDATED FINANCIAL STATEMENTS
(Dollars in Thousands Except Share and Per Share Amounts)
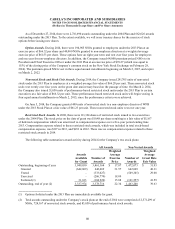
As of December 27, 2014, there were 2,716,690 awards outstanding under the 2004 Plan and 662,026 awards
outstanding under the 2013 Plan. To the extent available, we will issue treasury shares for the exercise of stock
options before issuing new shares.
Option Awards. During 2014, there were 194,905 NSOs granted to employees under the 2013 Plan at an
exercise price of $66.32 per share and 40,000 NSOs granted to non-employee directors at a weighted average
exercise price of $61.53 per share. These options have an eight-year term and vest over four years for employees
and one year for non-employee directors. In addition, the Company issued 64,000 premium-priced NSOs to its
President and Chief Executive Officer under the 2013 Plan at an exercise price of $76.27 (which was equal to
115% of the closing price of the Company’s common stock on the New York Stock Exchange on February 28,
2014). The premium-priced NSOs vest in three equal annual installments beginning on March 2, 2017, and expire
on March 2, 2022.
Nonvested Stock and Stock Unit Awards. During 2014, the Company issued 291,705 units of nonvested
stock under the 2013 Plan to employees at a weighted average fair value of $66.28 per unit. These nonvested stock
units vest evenly over four years on the grant date anniversary based on the passage of time. On March 2, 2014,
the Company also issued 51,050 units of performance-based restricted stock units under the 2013 Plan to certain
executives at a fair value of $66.32 per unit. These performance-based restricted stock units will begin vesting in
four equal annual installments on March 2, 2015, since the performance criteria were achieved.
On June 5, 2014, the Company granted 409 units of nonvested stock to a non-employee director of WFB
under the 2013 Stock Plan at a fair value of $61.23 per unit. These nonvested stock units vest over one year.
Restricted Stock Awards. In 2008, there were 111,324 shares of restricted stock issued to two executives
under the 2004 Plan. The stock price on the date of grant was $10.48 per share resulting in a fair value of $1,167
of deferred compensation which was amortized to compensation expense over a five-year period ending June
2013. Compensation expense related to these restricted stock awards, which was included in total stock-based
compensation expense, was $117 in 2013, and $233 in 2012. There was no compensation expense related to these
restricted stock awards in 2014.
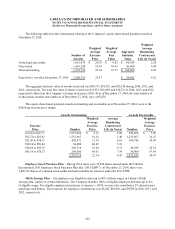
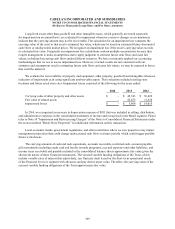
The following table summarizes award activity during 2014 for the Company’s two stock plans:
All Awards Non-Vested Awards
Awards
Available
for Grant
Number of
Awards
Weighted
Average
Exercise
Price
Number of
Awards
Weighted
Average
Grant Date
Fair Value
Outstanding, beginning of year 3,949,030 3,461,364 $ 17.87 1,472,073 $ 31.93
Granted (642,069) 642,069 31.57 642,069 48.31
Vested - (333,027) (549,345) 29.00
Exercised - (286,770) 18.09
Forfeited (1) 31,013 (104,920) 15.08 (101,557) 41.59
Outstanding, end of year (2) 3,337,974 3,378,716 22.34 1,463,240 39.63
(1) Options forfeited under the 2013 Plan are immediately available for grant.
(2) Total awards outstanding under the Company’s stock plans at the end of 2014 were comprised of 2,571,299 of
NSOs, 724,367 of nonvested stock awards, and 83,050 of performance based stock awards.