Cabela's 2014 Annual Report Download - page 9
Download and view the complete annual report
Please find page 9 of the 2014 Cabela's annual report below. You can navigate through the pages in the report by either clicking on the pages listed below, or by using the keyword search tool below to find specific information within the annual report.-
 1
1 -
 2
2 -
 3
3 -
 4
4 -
 5
5 -
 6
6 -
 7
7 -
 8
8 -
 9
9 -
 10
10 -
 11
11 -
 12
12 -
 13
13 -
 14
14 -
 15
15 -
 16
16 -
 17
17 -
 18
18 -
 19
19 -
 20
20 -
21
-
22
-
23
-
24
-
25
-
26
-
27
-
28
-
29
-
30
-
31
-
32
-
33
-
34
-
35
-
36
-
37
-
38
-
39
-
40
-
41
-
42
-
43
-
44
-
45
-
46
-
47
-
48
-
49
-
50
-
51
-
52
-
53
-
54
-
55
-
56
-
57
-
58
-
59
-
60
-
61
-
62
-
63
-
64
-
65
-
66
-
67
-
68
-
69
-
70
-
71
-
72
-
73
-
74
-
75
-
76
-
77
-
78
-
79
-
80
-
81
-
82
-
83
-
84
-
85
-
86
-
87
-
88
-
89
-
90
-
91
-
92
-
93
-
94
-
95
-
96
-
97
-
98
-
99
-
100
-
101
-
102
-
103
-
104
-
105
-
106
-
107
-
108
-
109
-
110
-
111
-
112
-
113
-
114
-
115
-
116
-
117
-
118
-
119
-
120
-
121
-
122
-
123
-
124
-
125
-
126
-
127
-
128
-
129
-
130
-
131
-
132
 |
 |

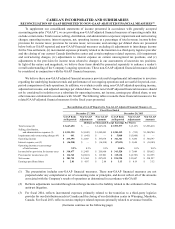
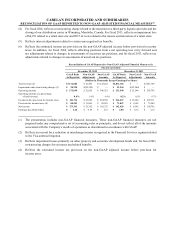
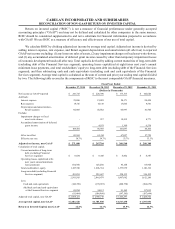
CABELA’S INCORPORATED AND SUBSIDIARIES
RECONCILIATION OF NON-GAAP RETURN ON INVESTED CAPITAL
Return on invested capital (“ROIC”) is not a measure of financial performance under generally accepted
accounting principles (“GAAP”) and may not be defined and calculated by other companies in the same manner.
ROIC should be considered supplemental to and not a substitute for financial information prepared in accordance
with GAAP. We use ROIC as a measure of efficiency and effectiveness of our use of total capital.
We calculate ROIC by dividing adjusted net income by average total capital. Adjusted net income is derived by
adding interest expense, rent expense, and Retail segment depreciation and amortization (all after tax) to reported
GAAP net income excluding: (1) any losses on sales of assets, (2) any impairment charges or fixed asset write-downs,
and (3) any accumulated amortization of deferred grant income caused by other than temporary impairment losses
of economic development bonds (all after tax). Total capital is derived by adding current maturities of long-term debt
(excluding debt of the Financial Services segment), operating leases capitalized at eight times next year’s annual
minimum lease payments, and total stockholders’ equity to long-term debt (excluding debt of the Financial Services
segment), and then subtracting cash and cash equivalents (excluding cash and cash equivalents of the Financial
Services segment). Average total capital is calculated as the sum of current and prior year ending total capital divided
by two. The following table reconciles the components of ROIC to the most comparable GAAP financial measures.
Fiscal Year Ended
December 27, 2014 December 28, 2013 December 29, 2012 December 31, 2011
(Dollars in Thousands)
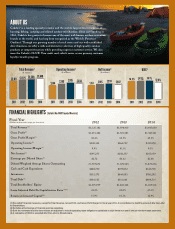
Net income as GAAP reported $ 201,715 $ 224,390 $ 173,513 $ 142,620
Add back:
Interest expense 21,860 21,889 20,171 24,454
Rent expense 19,716 14,319 13,605 9,541
Depreciation and amortization -
Retail segment 68,005 54,882 46,997 41,506
Exclude:
Impairment charges or fixed
asset write-downs - 937 19,015 4,771
Accumlated amortization of deferred
grant income - 4,931 1,309 6,538
109,581 96,958 101,097 86,810
After tax effect 69,365 63,314 67,027 57,729
Effective tax rate 36.7% 34.7% 33.7% 33.5%
Adjusted net income, non-GAAP $ 271,080 $ 287,704 $ 240,540 $ 200,349
Calculation of total capital:
Current maturities of long-term
debt (excluding Financial
Services segment) $ 8,434 $ 8,418 $ 8,402 $ 8,387
Operating leases capitalized at 8x
next year's annual minimum
lease payments 184,360 128,280 95,168 85,968
Total stockholders' equity 1,817,510 1,606,334 1,375,979 1,181,316
Long-term debt (excluding Financial
Services segment) 491,281 322,647 328,133 336,535
2,501,585 2,065,679 1,807,682 1,612,206
Less:
Cash and cash equivalents (142,758) (199,072) (288,750) (304,679)
Add back cash and cash equivalents
at the Financial Services segment 49,294 94,112 91,365 117,035
(93,464) (104,960) (197,385) (187,644)
Adjusted total capital, non-GAAP $ 2,408,121 $ 1,960,719 $ 1,610,297 $ 1,424,562
Average total capital, non-GAAP $ 2,184,420 $ 1,785,508 $1,517,430 $ 1,397,951
Return on Invested Capital, non-GAAP 12.4% 16.1% 15.9% 14.3%