Cabela's 2014 Annual Report Download - page 92
Download and view the complete annual report
Please find page 92 of the 2014 Cabela's annual report below. You can navigate through the pages in the report by either clicking on the pages listed below, or by using the keyword search tool below to find specific information within the annual report.-
 1
1 -
2
-
3
-
4
-
5
-
6
-
7
-
8
-
9
-
10
-
11
-
12
-
13
-
14
-
15
-
16
-
17
-
18
-
19
-
20
-
21
-
22
-
23
-
24
-
25
-
26
-
27
-
28
-
29
-
30
-
31
-
32
-
33
-
34
-
35
-
36
-
37
-
38
-
39
-
40
-
41
-
42
-
43
-
44
-
45
-
46
-
47
-
48
-
49
-
50
-
51
-
52
-
53
-
54
-
55
-
56
-
57
-
58
-
59
-
60
-
61
-
62
-
63
-
64
-
65
-
66
-
67
-
68
-
69
-
70
-
71
-
72
-
73
-
74
-
75
-
76
-
77
-
78
-
79
-
80
-
81
-
 82
82 -
 83
83 -
 84
84 -
 85
85 -
 86
86 -
 87
87 -
 88
88 -
 89
89 -
 90
90 -
 91
91 -
 92
92 -
 93
93 -
 94
94 -
 95
95 -
 96
96 -
 97
97 -
 98
98 -
 99
99 -
 100
100 -
 101
101 -
 102
102 -
103
-
104
-
105
-
106
-
107
-
108
-
109
-
110
-
111
-
112
-
113
-
114
-
115
-
116
-
117
-
118
-
119
-
120
-
121
-
122
-
123
-
124
-
125
-
126
-
127
-
128
-
129
-
130
-
131
-
132
 |
 |

82
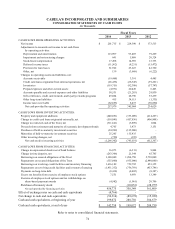
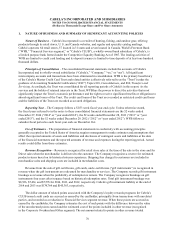
CABELA’S INCORPORATED AND SUBSIDIARIES
NOTES TO CONSOLIDATED FINANCIAL STATEMENTS
(Dollars in Thousands Except Share and Per Share Amounts)
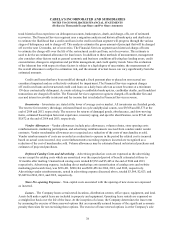
Comprehensive Income – Comprehensive income consists of net income, foreign currency translation
adjustments, cash flow hedges, and unrealized gains and losses on available-for-sale economic development bonds,
net of related income taxes.
Foreign Currency Translation – Assets and liabilities of Cabela’s Canadian operations are translated into
United States dollars at currency exchange rates in effect at the end of a reporting period. Gains and losses from
translation into United States dollars are included in accumulated other comprehensive income (loss) in our
consolidated balance sheets. Revenues and expenses are translated at average monthly currency exchange rates.
Earnings Per Share – Basic earnings per share is computed by dividing net income by the weighted average
number of shares of common stock outstanding during the period. Diluted earnings per share is computed by
dividing net income by the sum of the weighted average number of shares outstanding plus all additional common
shares that would have been outstanding if potentially dilutive common share equivalents had been issued.
2. ACCOUNTING PRONOUNCEMENTS
In May 2014, the Financial Accounting Standards Board issued Accounting Standards Update (“ASU”)
2014-09 “Revenue from Contracts with Customers” (Topic 606) (“ASU 2014-09”). ASU 2014-09 is a
comprehensive new revenue recognition model requiring a company to recognize revenue to depict the transfer
of goods or services to a customer at an amount reflecting the consideration it expects to receive in exchange for
those goods or services. In adopting ASU 2014-09, companies may use either a full retrospective or a modified
retrospective approach. ASU 2014-09 is effective for the first interim period within annual reporting periods
beginning after December 15, 2016, and early adoption is not permitted. Under the current implementation time
line, the Company will adopt ASU 2014-09 during the first quarter of fiscal 2017. Management is evaluating the
provisions of this statement and has not yet selected a transition method and has not determined what impact the
adoption of ASU 2014-09 will have on the Company’s financial position or results of operations.
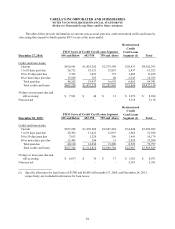
3. CABELA’S MASTER CREDIT CARD TRUST
The Financial Services segment utilizes the Trust for the purpose of routinely securitizing credit card
loans and issuing beneficial interest to investors. The Trust issues variable funding facilities and long-term notes
(collectively referred to herein as “secured obligations of the Trust”), each of which has an undivided interest
in the assets of the Trust. The Financial Services segment owns notes issued by the Trust from some of the
securitizations, which in some cases may be subordinated to other notes issued.
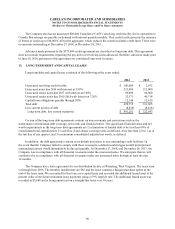
The following table presents the components of the consolidated assets and liabilities of the Trust at the
years ended:
2014 2013
Consolidated assets:
Restricted credit card loans, net of allowance of $56,280 and $52,820 $4,384,240 $3,903,410
Restricted cash 334,812 23,191
Tot al $ 4,719,052 $3,926,601
Consolidated liabilities:
Secured variable funding obligations $ 480,000 $ 50,000
Secured long-term obligations 3,047,250 2,452,250
Interest due to third party investors 2,256 1,904
Tot al $ 3,529,506 $2,504,154