Cabela's 2014 Annual Report Download - page 61
Download and view the complete annual report
Please find page 61 of the 2014 Cabela's annual report below. You can navigate through the pages in the report by either clicking on the pages listed below, or by using the keyword search tool below to find specific information within the annual report.-
 1
1 -
2
-
3
-
4
-
5
-
6
-
7
-
8
-
9
-
10
-
11
-
12
-
13
-
14
-
15
-
16
-
17
-
18
-
19
-
20
-
21
-
22
-
23
-
24
-
25
-
26
-
27
-
28
-
29
-
30
-
31
-
32
-
33
-
34
-
35
-
36
-
37
-
38
-
39
-
40
-
41
-
42
-
43
-
44
-
45
-
46
-
47
-
48
-
49
-
50
-
 51
51 -
 52
52 -
 53
53 -
 54
54 -
 55
55 -
 56
56 -
 57
57 -
 58
58 -
 59
59 -
 60
60 -
 61
61 -
 62
62 -
 63
63 -
 64
64 -
 65
65 -
 66
66 -
 67
67 -
 68
68 -
 69
69 -
 70
70 -
 71
71 -
72
-
73
-
74
-
75
-
76
-
77
-
78
-
79
-
80
-
81
-
82
-
83
-
84
-
85
-
86
-
87
-
88
-
89
-
90
-
91
-
92
-
93
-
94
-
95
-
96
-
97
-
98
-
99
-
100
-
101
-
102
-
103
-
104
-
105
-
106
-
107
-
108
-
109
-
110
-
111
-
112
-
113
-
114
-
115
-
116
-
117
-
118
-
119
-
120
-
121
-
122
-
123
-
124
-
125
-
126
-
127
-
128
-
129
-
130
-
131
-
132
 |
 |

51
In the fourth quarter of 2012, we received information on one project that the development would be delayed
thus reducing the amount expected to be received and delaying the timing of projected cash flows. Therefore,
the fair value of this economic development bond was determined to be below carrying value, with the decline
in fair value deemed to be other than temporary. This fair value adjustment totaled $5 million in 2012, reduced
the carrying value of the economic development bond portfolio at the end 2012, and resulted in corresponding
reductions in deferred grant income. This reduction in deferred grant income resulted in increases in depreciation
expense of approximately $1 million in 2012, which has been included in impairment and restructuring charges
in the consolidated statements of income. The discounted cash flow models for our other bonds did not result in
other than temporary impairments. In 2013, none of the bonds with a fair value below carrying value were deemed
to have other than a temporary impairment. At the end of 2012, the total amount of impairment adjustments that
were made to deferred grant income, which has been recorded as a reduction of property and equipment, was
$39 million. These impairment adjustments made to deferred grant income resulted from events or changes in
circumstances that indicated the amount of deferred grant income may not be recovered or realized in cash through
collection, sales, or other proceeds from the economic development bonds. All impairment and restructuring
charges related to economic development bonds were recorded to the Corporate Overhead and Other segment.
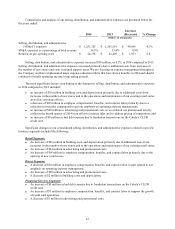
Operating Income
Comparisons and analysis of operating income are presented below for the years ended:
2013 2012
Increase
(Decrease) % Change
(Dollars in Thousands)
Total operating income $ 361,361 $ 275,699 $ 85,662 31.1%
Total operating income as a percentage of total revenue 10.0% 8.9% 1.1%
Operating income by business segment:
Retail $ 428,361 $ 345,040 $ 83,321 24.1
Direct 157,227 155,237 1,990 1.3
Financial Services 104,402 74,182 30,220 40.7
Operating income as a percentage of segment revenue:
Retail 19.2% 18.7% 0.5%
Direct 16.1 16.7 (0.6)
Financial Services 27.8 23.2 4.6
Operating income increased $86 million, or 31.1%, in 2013 compared to 2012, and operating income as a
percentage of revenue increased 110 basis points to 10.0% for 2013. The increase in total operating income was
primarily due to increases in revenue from all business segments as well as an increase in our merchandise gross
profit. This improvement was partially offset by higher consolidated operating expenses. Selling, distribution, and
administrative expenses increased in 2013 compared to 2012 primarily due to increases in comparable and new
store costs and related support areas.
Under an Intercompany Agreement, the Financial Services segment pays to the Retail and Direct business
segments a fixed license fee equal to 70 basis points on all originated charge volume of the Cabela’s CLUB Visa
credit card portfolio. In addition, among other items, the agreement requires the Financial Services segment
to reimburse the Retail and Direct segments for certain operating and promotional costs. Fees paid under the
Intercompany Agreement by the Financial Services segment to these two segments increased $18 million in 2013
compared to 2012; a $19 million increase to the Retail segment and a $1 million decrease to the Direct segment.