Cabela's 2014 Annual Report Download - page 57
Download and view the complete annual report
Please find page 57 of the 2014 Cabela's annual report below. You can navigate through the pages in the report by either clicking on the pages listed below, or by using the keyword search tool below to find specific information within the annual report.-
 1
1 -
2
-
3
-
4
-
5
-
6
-
7
-
8
-
9
-
10
-
11
-
12
-
13
-
14
-
15
-
16
-
17
-
18
-
19
-
20
-
21
-
22
-
23
-
24
-
25
-
26
-
27
-
28
-
29
-
30
-
31
-
32
-
33
-
34
-
35
-
36
-
37
-
38
-
39
-
40
-
41
-
42
-
43
-
44
-
45
-
46
-
 47
47 -
 48
48 -
 49
49 -
 50
50 -
 51
51 -
 52
52 -
 53
53 -
 54
54 -
 55
55 -
 56
56 -
 57
57 -
 58
58 -
 59
59 -
 60
60 -
 61
61 -
 62
62 -
 63
63 -
 64
64 -
 65
65 -
 66
66 -
 67
67 -
68
-
69
-
70
-
71
-
72
-
73
-
74
-
75
-
76
-
77
-
78
-
79
-
80
-
81
-
82
-
83
-
84
-
85
-
86
-
87
-
88
-
89
-
90
-
91
-
92
-
93
-
94
-
95
-
96
-
97
-
98
-
99
-
100
-
101
-
102
-
103
-
104
-
105
-
106
-
107
-
108
-
109
-
110
-
111
-
112
-
113
-
114
-
115
-
116
-
117
-
118
-
119
-
120
-
121
-
122
-
123
-
124
-
125
-
126
-
127
-
128
-
129
-
130
-
131
-
132
 |
 |

47
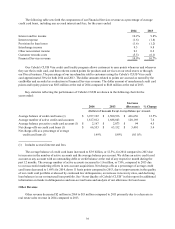
The following table sets forth the components of our Financial Services revenue as a percentage of average
total credit card loans, including any accrued interest and fees, for the years ended:
2013 2012
Interest and fee income 9.8% 9.7%
Interest expense (1.8) (1.7)
Provision for loan losses (1.2) (1.4)
Interchange income 9.8 9.4
Other non-interest income 0.2 0.4
Customer rewards costs (6.1) (6.1)
Financial Services revenue 10.7% 10.3%
Interchange income as a percentage of average credit card loans, including any accrued interest and fees,
would have been 9.8% for both 2013 and 2012, and Financial Services revenue as a percentage of average credit
card loans, including any accrued interest and fees, would have been 10.6% and 10.7% for 2013 and 2012,
respectively, excluding the effect of the $3.2 million increase and the $12.5 million decrease in 2013 and 2012,
respectively, to interchange income from the Visa settlement.
The percentage of our merchandise sold to customers using the Cabela’s CLUB Visa credit card approximated
30% for 2013. The dollar amounts related to points are accrued as earned by the cardholder and recorded as a
reduction in Financial Services revenue. The dollar amount of unredeemed credit card points and loyalty points
was $146 million at the end of 2013 compared to $128 million at the end of 2012.
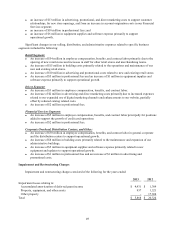
Key statistics reflecting the performance of Cabela’s CLUB are shown in the following chart for the
years ended:
2013 2012
Increase
(Decrease) % Change
(Dollars in Thousands Except Average Balance per Account)
Average balance of credit card loans (1) $ 3,500,536 $ 3,095,781 $ 404,755 13.1%
Average number of active credit card accounts 1,688,843 1,537,209 151,634 9.9
Average balance per active credit card account (1) $ 2,073 $ 2,014 $ 59 2.9
Net charge-offs on credit card loans (1) $ 63,152 $ 57,803 $ 5,349 9.3
Net charge-offs as a percentage of average managed
credit card loans (1) 1.80% 1.87% (0.07)%
(1) Includes accrued interest and fees.
The average balance of credit card loans increased to $3.5 billion, or 13.1%, for 2013 compared to 2012 due
to an increase in the number of active accounts and the average balance per account. We define an active credit
card account as any account with an outstanding debit or credit balance at the end of any respective month during
the past 12 months. The average number of active accounts increased to 1.7 million, or 9.9%, compared to 2012
due to our successful marketing efforts in new account acquisitions. Net charge-offs as a percentage of average
credit card loans decreased to 1.80% for 2013, down seven basis points compared to 2012, due to improvements in
bankruptcies, delinquencies, and delinquency roll rates, partially offset by a decrease in recoveries.
Other Revenue
Other revenue increased $4 million in 2013 to $17 million compared to 2012 primarily due to an increase in
real estate sales revenue in 2013 compared to 2012.