Cabela's 2014 Annual Report Download - page 2
Download and view the complete annual report
Please find page 2 of the 2014 Cabela's annual report below. You can navigate through the pages in the report by either clicking on the pages listed below, or by using the keyword search tool below to find specific information within the annual report.-
 1
1 -
 2
2 -
 3
3 -
 4
4 -
 5
5 -
 6
6 -
 7
7 -
 8
8 -
 9
9 -
 10
10 -
 11
11 -
 12
12 -
 13
13 -
14
-
15
-
16
-
17
-
18
-
19
-
20
-
21
-
22
-
23
-
24
-
25
-
26
-
27
-
28
-
29
-
30
-
31
-
32
-
33
-
34
-
35
-
36
-
37
-
38
-
39
-
40
-
41
-
42
-
43
-
44
-
45
-
46
-
47
-
48
-
49
-
50
-
51
-
52
-
53
-
54
-
55
-
56
-
57
-
58
-
59
-
60
-
61
-
62
-
63
-
64
-
65
-
66
-
67
-
68
-
69
-
70
-
71
-
72
-
73
-
74
-
75
-
76
-
77
-
78
-
79
-
80
-
81
-
82
-
83
-
84
-
85
-
86
-
87
-
88
-
89
-
90
-
91
-
92
-
93
-
94
-
95
-
96
-
97
-
98
-
99
-
100
-
101
-
102
-
103
-
104
-
105
-
106
-
107
-
108
-
109
-
110
-
111
-
112
-
113
-
114
-
115
-
116
-
117
-
118
-
119
-
120
-
121
-
122
-
123
-
124
-
125
-
126
-
127
-
128
-
129
-
130
-
131
-
132
 |
 |

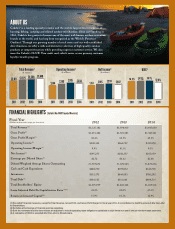
FINANCIAL HIGHLIGHTS
(1)
(3)
Operating Income(1)
($ millions)
2011
$244 $309 $365 $338
2012 2013 2014
Total Revenue(1)
($ millions)
2011
$2,811 $3,125 $3,596 $3,648
2012 2013 2014
($ millions)
Net Income(1)
2011
$151 $195 $238 $207
2012 2013 2014
2
20
2
2
2
$1$1
$1
1
51
51
51
51
$1
$1
$1
$1
$
$
95
95
95
5
$2
$2
2
3838
3838
8
$2
$2
$2
$2
$
$
$
07
07
07
07
ROIC(4)
2011
14.3% 15.9% 16.1% 12.4%
2012 2013 2014
2
20
0
14
14
14
14
.
.3
.3
.3
%
%
%
%
%
15
15
15
15
.9
.9
.9
9
9
%
%
%
%
%
%
%
%
2
20
2
2
2
0
12
12
2
2
16
16
16
6
16
.1
.1
1
1
%
%
%
20
20
0
0
13
13
13
13
12
12
12
2
12
2
12
12
12
2
.4.4
.4
4
4
4
.4
.
%
%
%
%
%
%
20
2
20
0
14
14
1
14
14
4
ABOUT US
Cabela’s® is a leading specialty retailer, and the world’s largest direct marketer, of
hunting, fishing, camping and related outdoor merchandise. Since our founding in
1961, Cabela’s has grown to become one of the most well-known outdoor recreation
brands in the world, and has long been recognized as the World’s Foremost
Outfitter.
® Through our growing number of retail stores and our well-established
direct business, we offer a wide and distinctive selection of high-quality outdoor
products at competitive prices while providing superior customer service. We also
issue the Cabela’s CLUB® Visa credit card, which serves as our primary customer
loyalty rewards program.
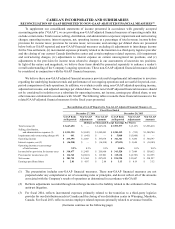
(Includes Non-GAAP Financial Measures)
Fiscal Year
(Dollars in thousands, except per share data)
Total Revenue(1)
Gross Profit(1)
Gross Profit Margin(1)
Operating Income(1)
Operating Income Margin(1)
Net Income(1)
Earnings per Diluted Share(1)
Diluted Weighted Average Shares Outstanding
Cash and Cash Equivalents
Inventories
Total Debt(2)
Total Stockholders’ Equity
Lease Adjusted Debt-To-Capitalization Ratio(2)(3)
Return on Invested Capital(4)
2012 2013 2014
$3,125,182 $3,596,410 $3,647,650
$1,355,384 $1,565,581 $1,587,361
43.4% 43.5% 43.5%
$308,523 $364,797 $337,878
9.9% 10.1% 9.3%
$195,275 $238,257 $207,059
$2.72 $3.32 $2.88
71,709,873 71,778,543 71,877,856
$288,750 $199,072 $142,758
$552,575 $644,883 $760,293
$336,535 $331,065 $499,715
$1,375,979 $1,606,334 $1,817,510
23.9% 22.2% 27.3%
15.9% 16.1% 12.4%