Cabela's 2014 Annual Report Download - page 64
Download and view the complete annual report
Please find page 64 of the 2014 Cabela's annual report below. You can navigate through the pages in the report by either clicking on the pages listed below, or by using the keyword search tool below to find specific information within the annual report.-
 1
1 -
2
-
3
-
4
-
5
-
6
-
7
-
8
-
9
-
10
-
11
-
12
-
13
-
14
-
15
-
16
-
17
-
18
-
19
-
20
-
21
-
22
-
23
-
24
-
25
-
26
-
27
-
28
-
29
-
30
-
31
-
32
-
33
-
34
-
35
-
36
-
37
-
38
-
39
-
40
-
41
-
42
-
43
-
44
-
45
-
46
-
47
-
48
-
49
-
50
-
51
-
52
-
53
-
 54
54 -
 55
55 -
 56
56 -
 57
57 -
 58
58 -
 59
59 -
 60
60 -
 61
61 -
 62
62 -
 63
63 -
 64
64 -
 65
65 -
 66
66 -
 67
67 -
 68
68 -
 69
69 -
 70
70 -
 71
71 -
 72
72 -
 73
73 -
 74
74 -
75
-
76
-
77
-
78
-
79
-
80
-
81
-
82
-
83
-
84
-
85
-
86
-
87
-
88
-
89
-
90
-
91
-
92
-
93
-
94
-
95
-
96
-
97
-
98
-
99
-
100
-
101
-
102
-
103
-
104
-
105
-
106
-
107
-
108
-
109
-
110
-
111
-
112
-
113
-
114
-
115
-
116
-
117
-
118
-
119
-
120
-
121
-
122
-
123
-
124
-
125
-
126
-
127
-
128
-
129
-
130
-
131
-
132
 |
 |

54
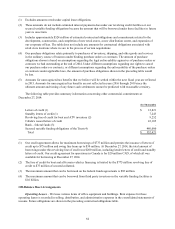
The following table shows the activity in our allowance for loan losses and charge-off activity for the
years ended:
2014 2013 2012
(Dollars in Thousands)
Balance, beginning of year $ 53,110 $ 65,600 $ 73,350
Provision for loan losses 61,922 43,223 42,760
Charge-offs (76,868) (72,959) (68,834)
Recoveries 18,408 17,246 18,324
Net charge-offs (58,460) (55,713) (50,510)
Balance, end of year $ 56,572 $ 53,110 $ 65,600
Net charge-offs on credit card loans $ (58,460) $ (55,713) $ (50,510)
Charge-offs of accrued interest and fees
(recorded as a reduction in interest and fee income) (8,093) (7,439) (7,293)
Total net charge-offs including accrued interest and fees $ (66,553) $ (63,152) $ (57,803)
Net charge-offs, including accrued interest and fees,
as a percentage of average credit card loans,
including accrued interest and fees 1.69% 180% 1.87%
For 2014, net charge-offs as a percentage of average credit card loans decreased to 1.69%, down 11 basis
points compared to 1.80% for 2013. Our charge-off levels remain well below industry averages. Our net charge-off
rates and the percentage of the allowance for loan losses to our credit card portfolio have decreased due to
improvements in the quality of our credit card portfolio evidenced by continued low delinquencies, an increase in
recovery rates, and declining loan balances in our restructured loan portfolio.
Aging of Credit Cards Loans Outstanding
The following table shows our credit card loans outstanding at the end of 2014 and 2013 segregated by the
number of months passed since the accounts were opened.
2014 2013
Months Since Account Opened
Loans
Outstanding
Percentage
of Total
Loans
Outstanding
Percentage
of Total
(Dollars in Thousands)
6 months or less $ 186,550 4.2% $ 171,206 4.3%
7 – 12 months 167,531 3.7 170,840 4.3
13 – 24 months 410,728 9.2 336,250 8.4
25 – 36 months 361,750 8.1 330,048 8.3
37 – 48 months 342,103 7.6 273,569 6.9
49 – 60 months 282,882 6.3 287,381 7.2
61 – 72 months 294,044 6.6 291,419 7.3
73 – 84 months 295,573 6.6 324,751 8.1
More than 84 months 2,130,973 47.7 1,800,385 45.2
Total $ 4,472,134 100.0% $ 3,985,849 100.0%