Cabela's 2014 Annual Report Download - page 46
Download and view the complete annual report
Please find page 46 of the 2014 Cabela's annual report below. You can navigate through the pages in the report by either clicking on the pages listed below, or by using the keyword search tool below to find specific information within the annual report.-
 1
1 -
2
-
3
-
4
-
5
-
6
-
7
-
8
-
9
-
10
-
11
-
12
-
13
-
14
-
15
-
16
-
17
-
18
-
19
-
20
-
21
-
22
-
23
-
24
-
25
-
26
-
27
-
28
-
29
-
30
-
31
-
32
-
33
-
34
-
35
-
 36
36 -
 37
37 -
 38
38 -
 39
39 -
 40
40 -
 41
41 -
 42
42 -
 43
43 -
 44
44 -
 45
45 -
 46
46 -
 47
47 -
 48
48 -
 49
49 -
 50
50 -
 51
51 -
 52
52 -
 53
53 -
 54
54 -
 55
55 -
 56
56 -
57
-
58
-
59
-
60
-
61
-
62
-
63
-
64
-
65
-
66
-
67
-
68
-
69
-
70
-
71
-
72
-
73
-
74
-
75
-
76
-
77
-
78
-
79
-
80
-
81
-
82
-
83
-
84
-
85
-
86
-
87
-
88
-
89
-
90
-
91
-
92
-
93
-
94
-
95
-
96
-
97
-
98
-
99
-
100
-
101
-
102
-
103
-
104
-
105
-
106
-
107
-
108
-
109
-
110
-
111
-
112
-
113
-
114
-
115
-
116
-
117
-
118
-
119
-
120
-
121
-
122
-
123
-
124
-
125
-
126
-
127
-
128
-
129
-
130
-
131
-
132
 |
 |

36
Operations Review
Our operating results expressed as a percentage of revenue were as follows for the years ended:
2014 2013 2012
Revenue 100.00% 100.00% 100.00%
Cost of revenue (exclusive of depreciation and amortization) 56.48 56.42 56.86
Gross profit 43.52 43.58 43.14
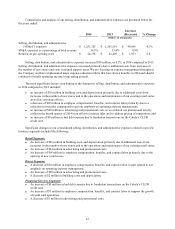
Selling, distribution, and administrative expenses 34.30 33.38 33.63
Impairment and restructuring charges 0.02 0.16 0.65
Operating income 9.20 10.04 8.86
Other income (expense):
Interest expense, net (0.60) (0.61) (0.65)
Other income, net 0.13 0.11 0.20
Total other income (expense), net (0.47) (0.50) (0.45)
Income before provision for income taxes 8.73 9.54 8.41
Provision for income taxes 3.20 3.31 2.83
Net income 5.53% 6.23% 5.58%
Results of Operations - 2014 Compared to 2013
Revenues
Retail revenue includes sales realized and customer services performed at our retail stores, sales from orders
placed through our retail store Internet kiosks, and sales from customers utilizing our in-store pick-up program.
Direct revenue includes Internet and call center (catalog) sales from orders placed through our website, over
the phone, and by mail where the merchandise is shipped through our omni-channel fulfillment process to our
customers at locations of their choice. Retail and Direct revenue also includes sales from the redemption of loyalty
points earned by Cabela’s CLUB Visa cardholders of our Financial Services segment. Financial Services revenue
is comprised of interest and fee income, interchange income, other non-interest income, interest expense, provision
for loan losses, and customer rewards costs from our credit card operations. Other revenue sources include fees for
our hunting and fishing outfitter services, fees for our full-service travel agency business, real estate rental income
and land sales, and other complementary business services.
We have added our retail stores to our distribution network, so customers who order through our call centers
or website are no longer solely dependent upon the stock we have in our distribution centers. We now ship products
to our customers from both our distribution centers and our retail stores.
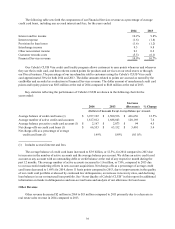
Comparisons and analysis of our revenues are presented below for the years ended:
2014 % 2013 %
Increase
(Decrease)
%
Change
(Dollars in Thousands)
Retail $ 2,350,685 64.4% $ 2,233,322 62.0% $ 117,363 5.3%
Direct 851,738 23.4 973,614 27.1 (121,876) (12.5)
Financial Services 430,385 11.8 375,810 10.4 54,575 14.5
Other 14,842 0.4 16,831 0.5 (1,989) (11.8)
Total $ 3,647,650 100.0% $ 3,599,577 100.0% $ 48,073 1.3