Cabela's 2014 Annual Report Download - page 93
Download and view the complete annual report
Please find page 93 of the 2014 Cabela's annual report below. You can navigate through the pages in the report by either clicking on the pages listed below, or by using the keyword search tool below to find specific information within the annual report.-
 1
1 -
2
-
3
-
4
-
5
-
6
-
7
-
8
-
9
-
10
-
11
-
12
-
13
-
14
-
15
-
16
-
17
-
18
-
19
-
20
-
21
-
22
-
23
-
24
-
25
-
26
-
27
-
28
-
29
-
30
-
31
-
32
-
33
-
34
-
35
-
36
-
37
-
38
-
39
-
40
-
41
-
42
-
43
-
44
-
45
-
46
-
47
-
48
-
49
-
50
-
51
-
52
-
53
-
54
-
55
-
56
-
57
-
58
-
59
-
60
-
61
-
62
-
63
-
64
-
65
-
66
-
67
-
68
-
69
-
70
-
71
-
72
-
73
-
74
-
75
-
76
-
77
-
78
-
79
-
80
-
81
-
82
-
 83
83 -
 84
84 -
 85
85 -
 86
86 -
 87
87 -
 88
88 -
 89
89 -
 90
90 -
 91
91 -
 92
92 -
 93
93 -
 94
94 -
 95
95 -
 96
96 -
 97
97 -
 98
98 -
 99
99 -
 100
100 -
 101
101 -
 102
102 -
 103
103 -
104
-
105
-
106
-
107
-
108
-
109
-
110
-
111
-
112
-
113
-
114
-
115
-
116
-
117
-
118
-
119
-
120
-
121
-
122
-
123
-
124
-
125
-
126
-
127
-
128
-
129
-
130
-
131
-
132
 |
 |

83
CABELA’S INCORPORATED AND SUBSIDIARIES
NOTES TO CONSOLIDATED FINANCIAL STATEMENTS
(Dollars in Thousands Except Share and Per Share Amounts)
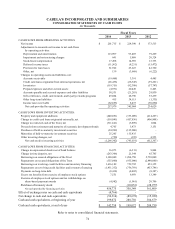
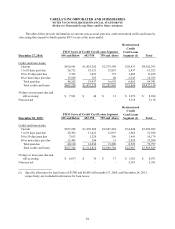
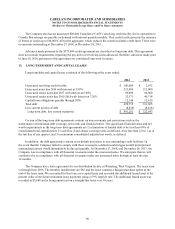
4. CREDIT CARD LOANS AND ALLOWANCE FOR LOAN LOSSES
The following table reflects the composition of the credit card loans at the years ended:
2014 2013
Restricted credit card loans of the Trust (restricted for repayment of secured
obligations of the Trust) $4,440,520 $3,956,230
Unrestricted credit card loans 31,614 29,619
Total credit card loans 4,472,134 3,985,849
Allowance for loan losses (56,572) (53,110)
Deferred credit card origination costs 5,623 5,891
Credit card loans, net $ 4,421,185 $3,938,630
Allowance for Loan Losses:
The following table reflects the activity in the allowance for loan losses by credit card segment for the
years ended:
2014 2013
Credit Card
Loans
Restructured
Credit Card
Loans
Total
Credit Card
Loans
Credit Card
Loans
Restructured
Credit Card
Loans
Total
Credit Card
Loans
Balance, beginning of year $ 44,660 $ 8,450 $ 53,110 $ 42,600 $ 23,000 $ 65,600
Provision for loan losses 52,135 9,787 61,922 47,809 (4,586) 43,223
Charge-offs (62,150) (14,718) (76,868) (58,736) (14,223) (72,959)
Recoveries 14,187 4,221 18,408 12,987 4,259 17,246
Net charge-offs (47,963) (10,497) (58,460) (45,749) (9,964) (55,713)
Balance, end of year $ 48,832 $ 7,740 $ 56,572 $ 44,660 $ 8,450 $ 53,110
Credit Quality Indicators, Delinquent, and Non-Accrual Loans:
The Financial Services segment segregates the loan portfolio into loans that have been restructured and other
credit card loans in order to facilitate the estimation of the losses inherent in the portfolio as of the reporting date.
The Financial Services segment uses the scores of Fair Isaac Corporation (“FICO”), a widely-used financial metric
for assessing an individual’s credit rating, as the primary credit quality indicator, with the risk of loss increasing as
an individual’s FICO score decreases.