Cabela's 2014 Annual Report Download - page 81
Download and view the complete annual report
Please find page 81 of the 2014 Cabela's annual report below. You can navigate through the pages in the report by either clicking on the pages listed below, or by using the keyword search tool below to find specific information within the annual report.-
 1
1 -
2
-
3
-
4
-
5
-
6
-
7
-
8
-
9
-
10
-
11
-
12
-
13
-
14
-
15
-
16
-
17
-
18
-
19
-
20
-
21
-
22
-
23
-
24
-
25
-
26
-
27
-
28
-
29
-
30
-
31
-
32
-
33
-
34
-
35
-
36
-
37
-
38
-
39
-
40
-
41
-
42
-
43
-
44
-
45
-
46
-
47
-
48
-
49
-
50
-
51
-
52
-
53
-
54
-
55
-
56
-
57
-
58
-
59
-
60
-
61
-
62
-
63
-
64
-
65
-
66
-
67
-
68
-
69
-
70
-
 71
71 -
 72
72 -
 73
73 -
 74
74 -
 75
75 -
 76
76 -
 77
77 -
 78
78 -
 79
79 -
 80
80 -
 81
81 -
 82
82 -
 83
83 -
 84
84 -
 85
85 -
 86
86 -
 87
87 -
 88
88 -
 89
89 -
 90
90 -
 91
91 -
92
-
93
-
94
-
95
-
96
-
97
-
98
-
99
-
100
-
101
-
102
-
103
-
104
-
105
-
106
-
107
-
108
-
109
-
110
-
111
-
112
-
113
-
114
-
115
-
116
-
117
-
118
-
119
-
120
-
121
-
122
-
123
-
124
-
125
-
126
-
127
-
128
-
129
-
130
-
131
-
132
 |
 |

71
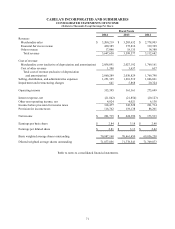
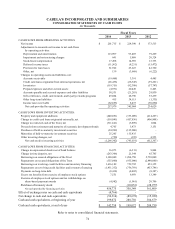
CABELA’S INCORPORATED AND SUBSIDIARIES
CONSOLIDATED STATEMENTS OF INCOME
(Dollars in Thousands Except Earnings Per Share)
Fiscal Years
2014 2013 2012
Revenue:
Merchandise sales $ 3,200,219 $ 3,205,632 $ 2,778,903
Financial Services revenue 430,385 375,810 319,399
Other revenue 17,046 18,135 14,380
Total revenue 3,647,650 3,599,577 3,112,682
Cost of revenue:
Merchandise costs (exclusive of depreciation and amortization) 2,058,891 2,027,192 1,769,161
Cost of other revenue 1,398 3,637 637
Total cost of revenue (exclusive of depreciation
and amortization) 2,060,289 2,030,829 1,769,798
Selling, distribution, and administrative expenses 1,251,325 1,201,519 1,046,861
Impairment and restructuring charges 641 5,868 20,324
Operating income 335,395 361,361 275,699
Interest expense, net (21,842) (21,854) (20,123)
Other non-operating income, net 4,924 4,021 6,138
Income before provision for income taxes 318,477 343,528 261,714
Provision for income taxes 116,762 119,138 88,201
Net income $ 201,715 $ 224,390 $ 173,513
Earnings per basic share $ 2.84 $ 3.18 $ 2.48
Earnings per diluted share $ 2.81 $ 3.13 $ 2.42
Basic weighted average shares outstanding 70,987,168 70,461,450 69,856,258
Diluted weighted average shares outstanding 71,877,856 71,778,543 71,709,873
Refer to notes to consolidated financial statements.