Cabela's 2014 Annual Report Download - page 50
Download and view the complete annual report
Please find page 50 of the 2014 Cabela's annual report below. You can navigate through the pages in the report by either clicking on the pages listed below, or by using the keyword search tool below to find specific information within the annual report.-
 1
1 -
2
-
3
-
4
-
5
-
6
-
7
-
8
-
9
-
10
-
11
-
12
-
13
-
14
-
15
-
16
-
17
-
18
-
19
-
20
-
21
-
22
-
23
-
24
-
25
-
26
-
27
-
28
-
29
-
30
-
31
-
32
-
33
-
34
-
35
-
36
-
37
-
38
-
39
-
 40
40 -
 41
41 -
 42
42 -
 43
43 -
 44
44 -
 45
45 -
 46
46 -
 47
47 -
 48
48 -
 49
49 -
 50
50 -
 51
51 -
 52
52 -
 53
53 -
 54
54 -
 55
55 -
 56
56 -
 57
57 -
 58
58 -
 59
59 -
 60
60 -
61
-
62
-
63
-
64
-
65
-
66
-
67
-
68
-
69
-
70
-
71
-
72
-
73
-
74
-
75
-
76
-
77
-
78
-
79
-
80
-
81
-
82
-
83
-
84
-
85
-
86
-
87
-
88
-
89
-
90
-
91
-
92
-
93
-
94
-
95
-
96
-
97
-
98
-
99
-
100
-
101
-
102
-
103
-
104
-
105
-
106
-
107
-
108
-
109
-
110
-
111
-
112
-
113
-
114
-
115
-
116
-
117
-
118
-
119
-
120
-
121
-
122
-
123
-
124
-
125
-
126
-
127
-
128
-
129
-
130
-
131
-
132
 |
 |

40
Merchandise Gross Profit
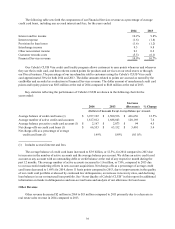
Merchandise gross profit is defined as merchandise sales, including shipping fees charged to customers, less
the costs of related merchandise sold and shipping costs. Comparisons of merchandise gross profit and merchandise
gross profit as a percentage of merchandise sales for our operations, year over year, and to the retail industry in
general, are impacted by:
x shifts in customer preferences;
x retail store, distribution, and warehousing costs (including depreciation and amortization), which we
exclude from our cost of revenue;
x royalty fees we include in merchandise sales for which there are no costs of revenue;
x customer service related revenue we include in merchandise sales for which there are no costs of
revenue; and
x shipping costs we include in cost of revenue.
Comparisons and analysis of our merchandise gross profit on merchandise sales are presented below for the
years ended:
2014 2013
Increase
(Decrease) % Change
(Dollars in Thousands)
Merchandise sales $ 3,200,219 $ 3,205,632 $ (5,413) (0.2)%
Merchandise gross profit 1,141,328 1,178,440 (37,112) (3.1)
Merchandise gross profit as a percentage of
merchandise sales 35.7% 36.8% (1.1)%
Our merchandise gross profit decreased $37 million, or 3.1%, to $1.1 billion in 2014 compared to 2013,
primarily due to a decrease in sales of firearms and ammunition in 2014 compared to 2013.
Our merchandise gross profit as a percentage of merchandise sales decreased 110 basis points to 35.7% in
2014 from 36.8% in 2013. The decrease in the merchandise gross profit as a percentage of merchandise sales in
2014 compared to 2013 was primarily due to increased sales discounts and markdowns, which had an impact of
approximately 70 basis points, and to an adjustment in the presentation of reimbursement between segments for
certain promotional costs totaling $15 million for 2014, which had an impact of approximately 50 basis points.
The effect of this reimbursement adjustment resulted in an increase in Financial Services revenue and an increase
in merchandise cost of sales by the same amount. This presentation will be ongoing and had no impact on
consolidated operating income or earnings per diluted share.
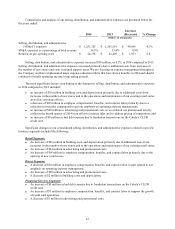
Selling, Distribution, and Administrative Expenses
Selling, distribution, and administrative expenses include all operating expenses related to our retail stores,
website, distribution centers, product procurement, Cabela’s CLUB credit card operations, and overhead costs,
including: advertising and marketing, catalog costs, employee compensation and benefits, occupancy costs,
information systems processing, and depreciation and amortization.