Cabela's 2014 Annual Report Download - page 73
Download and view the complete annual report
Please find page 73 of the 2014 Cabela's annual report below. You can navigate through the pages in the report by either clicking on the pages listed below, or by using the keyword search tool below to find specific information within the annual report.-
 1
1 -
2
-
3
-
4
-
5
-
6
-
7
-
8
-
9
-
10
-
11
-
12
-
13
-
14
-
15
-
16
-
17
-
18
-
19
-
20
-
21
-
22
-
23
-
24
-
25
-
26
-
27
-
28
-
29
-
30
-
31
-
32
-
33
-
34
-
35
-
36
-
37
-
38
-
39
-
40
-
41
-
42
-
43
-
44
-
45
-
46
-
47
-
48
-
49
-
50
-
51
-
52
-
53
-
54
-
55
-
56
-
57
-
58
-
59
-
60
-
61
-
62
-
 63
63 -
 64
64 -
 65
65 -
 66
66 -
 67
67 -
 68
68 -
 69
69 -
 70
70 -
 71
71 -
 72
72 -
 73
73 -
 74
74 -
 75
75 -
 76
76 -
 77
77 -
 78
78 -
 79
79 -
 80
80 -
 81
81 -
 82
82 -
 83
83 -
84
-
85
-
86
-
87
-
88
-
89
-
90
-
91
-
92
-
93
-
94
-
95
-
96
-
97
-
98
-
99
-
100
-
101
-
102
-
103
-
104
-
105
-
106
-
107
-
108
-
109
-
110
-
111
-
112
-
113
-
114
-
115
-
116
-
117
-
118
-
119
-
120
-
121
-
122
-
123
-
124
-
125
-
126
-
127
-
128
-
129
-
130
-
131
-
132
 |
 |

63
Furthermore, the securitized credit card loans of the Financial Services segment could experience poor
performance, including increased delinquencies and credit losses, lower payment rates, or a decrease in excess
spreads below certain thresholds. This could result in a downgrade or withdrawal of the ratings on the outstanding
securities issued in the Financial Services segment’s securitization transactions, cause early amortization of these
securities, or result in higher required credit enhancement levels. Credit card loans performed within established
guidelines and no events which could trigger an early amortization occurred during the years ended December 27,
2014, and December 28, 2013.
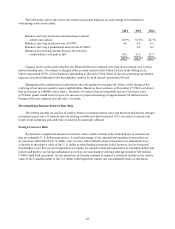
Certificates of Deposit
The Financial Services segment utilizes brokered and non-brokered certificates of deposit to partially finance
its operating activities. The Financial Services segment issues certificates of deposit in a minimum amount of
one hundred thousand dollars in various maturities. At December 27, 2014, the Financial Services segment had
$806 million of certificates of deposit outstanding with maturities ranging from January 2015 to July 2023 and
with a weighted average effective annual fixed rate of 2.25%. This outstanding balance compares to $1.1 billion at
December 28, 2013, with a weighted average effective annual fixed rate of 2.14%. For a summary schedule of the
contractual maturities of our certificates of deposit for the last two years, please refer to Note 10 “Time Deposits”
of the Notes to Consolidated Financial Statements.
Impact of Inflation
We do not believe that our operating results have been materially affected by inflation during the preceding three
years. We cannot assure, however, that our operating results will not be adversely affected by inflation in the future.
Contractual Obligations and Other Commercial Commitments
The following tables provide summary information concerning our future contractual obligations at
December 27, 2014.
2015 2016 2017 2018 2019 Thereafter Total
(In Thousands)
Long-term debt (1) $ 8,143 $ 223,143 $ 68,143 $ 8,142 $ 180,000 $ - $ 487,571
Interest payments on
long-term debt (2) 18,581 11,554 2,703 293 - - 33,131
Capital lease obligations 1,000 1,000 1,000 1,000 1,000 16,500 21,500
Operating leases 23,045 23,143 22,708 29,260 21,911 283,667 403,734
Time deposits by
maturity 273,081 215,691 26,056 20,930 37,186 233,112 806,056
Interest payments on
time deposits 15,536 10,089 7,802 7,581 7,019 21,808 69,835
Secured obligations
of the Trust 947,500 510,000 1,105,000 297,500 340,000 327,250 3,527,250
Interest payments on
secured obligations of
the Trust (2) 38,010 32,067 18,537 13,459 10,080 28,084 140,237
New store and other
construction
obligations (3) 568,144 548 569 571 571 4,389 574,792
Purchase obligations (4) 630,333 14,047 6,170 1,573 - - 652,123
Unrecognized tax
benefits (5) 46,317 - - - - 55,562 101,879
Total $ 2,569,690 $ 1,041,282 $ 1,258,688 $ 380,309 $ 597,767 $ 970,372 $ 6,818,108
(footnotes are on the following page)