Cabela's 2014 Annual Report Download - page 97
Download and view the complete annual report
Please find page 97 of the 2014 Cabela's annual report below. You can navigate through the pages in the report by either clicking on the pages listed below, or by using the keyword search tool below to find specific information within the annual report.-
 1
1 -
2
-
3
-
4
-
5
-
6
-
7
-
8
-
9
-
10
-
11
-
12
-
13
-
14
-
15
-
16
-
17
-
18
-
19
-
20
-
21
-
22
-
23
-
24
-
25
-
26
-
27
-
28
-
29
-
30
-
31
-
32
-
33
-
34
-
35
-
36
-
37
-
38
-
39
-
40
-
41
-
42
-
43
-
44
-
45
-
46
-
47
-
48
-
49
-
50
-
51
-
52
-
53
-
54
-
55
-
56
-
57
-
58
-
59
-
60
-
61
-
62
-
63
-
64
-
65
-
66
-
67
-
68
-
69
-
70
-
71
-
72
-
73
-
74
-
75
-
76
-
77
-
78
-
79
-
80
-
81
-
82
-
83
-
84
-
85
-
86
-
 87
87 -
 88
88 -
 89
89 -
 90
90 -
 91
91 -
 92
92 -
 93
93 -
 94
94 -
 95
95 -
 96
96 -
 97
97 -
 98
98 -
 99
99 -
 100
100 -
 101
101 -
 102
102 -
 103
103 -
 104
104 -
 105
105 -
 106
106 -
 107
107 -
108
-
109
-
110
-
111
-
112
-
113
-
114
-
115
-
116
-
117
-
118
-
119
-
120
-
121
-
122
-
123
-
124
-
125
-
126
-
127
-
128
-
129
-
130
-
131
-
132
 |
 |

87
CABELA’S INCORPORATED AND SUBSIDIARIES
NOTES TO CONSOLIDATED FINANCIAL STATEMENTS
(Dollars in Thousands Except Share and Per Share Amounts)
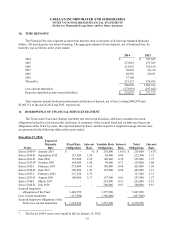
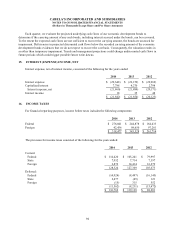
10. TIME DEPOSITS
The Financial Services segment accepts time deposits only in amounts of at least one hundred thousand
dollars. All time deposits are interest bearing. The aggregate amount of time deposits, net of brokered fees, by
maturity was as follows at the years ended:
2014 2013
2014 $ - $ 297,645
2015 273,081 273,385
2016 215,691 216,619
2017 26,056 26,110
2018 20,930 20,911
2019 37,186 -
Thereafter 233,112 234,692
806,056 1,069,362
Less current maturities (273,081) (297,645)
Deposits classified as non-current liabilities $ 532,975 $ 771,717
Time deposits include brokered institutional certificates of deposit, net of fees, totaling $802,076 and
$1,062,312 at the end of 2014 and 2013, respectively.
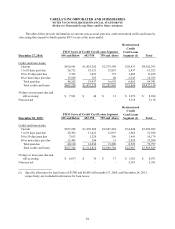
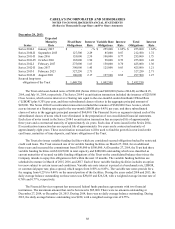
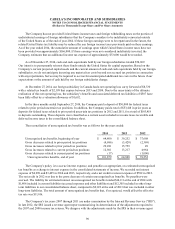
11. BORROWINGS OF FINANCIAL SERVICES SEGMENT
The Trust issues fixed and floating (variable) rate term securitizations, which are considered secured
obligations backed by restricted credit card loans. A summary of the secured fixed and variable rate long-term
obligations of the Trust by series, the expected maturity dates, and the respective weighted average interest rates
are presented in the following tables at the years ended:
December 27, 2014:
Series
Expected
Maturity
Date
Fixed Rate
Obligations
Interest
Rate
Var iable Rate
Obligations
Interest
Rate
Tot al
Obligations
Interest
Rate
Series 2010-I* January 2015 $ - -% $ 255,000 1.61% $ 255,000 1.61%
Series 2010-II September 2015 127,500 2.29 85,000 0.86 212,500 1.72
Series 2011-II June 2016 155,000 2.39 100,000 0.76 255,000 1.75
Series 2011-IV October 2016 165,000 1.90 90,000 0.71 255,000 1.48
Series 2012-I February 2017 275,000 1.63 150,000 0.69 425,000 1.30
Series 2012-II June 2017 300,000 1.45 125,000 0.64 425,000 1.21
Series 2013-I February 2023 327,250 2.71 - - 327,250 2.71
Series 2013-II August 2018 100,000 2.17 197,500 0.81 297,500 1.27
Series 2014-I March 2017 - - 255,000 0.51 255,000 0.51
Series 2014-II July 2019 - - 340,000 0.61 340,000 0.61
Secured long-term
obligations of the Trust 1,449,750 1,597,500 3,047,250
Less current maturities (127,500) (340,000) (467,500)
Secured long-term obligations of the
Trust, less current maturities $ 1,322,250 $ 1,257,500 $ 2,579,750
* The Series 2010-I notes were repaid in full on January 15, 2015.