Cabela's 2014 Annual Report Download - page 58
Download and view the complete annual report
Please find page 58 of the 2014 Cabela's annual report below. You can navigate through the pages in the report by either clicking on the pages listed below, or by using the keyword search tool below to find specific information within the annual report.-
 1
1 -
2
-
3
-
4
-
5
-
6
-
7
-
8
-
9
-
10
-
11
-
12
-
13
-
14
-
15
-
16
-
17
-
18
-
19
-
20
-
21
-
22
-
23
-
24
-
25
-
26
-
27
-
28
-
29
-
30
-
31
-
32
-
33
-
34
-
35
-
36
-
37
-
38
-
39
-
40
-
41
-
42
-
43
-
44
-
45
-
46
-
47
-
 48
48 -
 49
49 -
 50
50 -
 51
51 -
 52
52 -
 53
53 -
 54
54 -
 55
55 -
 56
56 -
 57
57 -
 58
58 -
 59
59 -
 60
60 -
 61
61 -
 62
62 -
 63
63 -
 64
64 -
 65
65 -
 66
66 -
 67
67 -
 68
68 -
69
-
70
-
71
-
72
-
73
-
74
-
75
-
76
-
77
-
78
-
79
-
80
-
81
-
82
-
83
-
84
-
85
-
86
-
87
-
88
-
89
-
90
-
91
-
92
-
93
-
94
-
95
-
96
-
97
-
98
-
99
-
100
-
101
-
102
-
103
-
104
-
105
-
106
-
107
-
108
-
109
-
110
-
111
-
112
-
113
-
114
-
115
-
116
-
117
-
118
-
119
-
120
-
121
-
122
-
123
-
124
-
125
-
126
-
127
-
128
-
129
-
130
-
131
-
132
 |
 |

48
Merchandise Gross Profit
Comparisons and analysis of our gross profit on merchandising revenue are presented below for the
years ended:
2013 2012
Increase
(Decrease) % Change
(Dollars in Thousands)
Merchandise sales $ 3,205,632 $ 2,778,903 $ 426,729 15.4%
Merchandise gross profit 1,178,440 1,009,742 168,698 16.7
Merchandise gross profit as a percentage of
merchandise sales 36.8% 36.3% 0.5%
Our merchandise gross profit increased $169 million, or 16.7%, to $1.2 billion in 2013 compared to 2012.
The increase in our merchandise gross profit was primarily due to firearms and ammunition, as well as continued
improvements in vendor collaboration, an increase in private label products, and further advancements in price
optimization. Ammunition sales, while still above prior year levels, slowed during the third quarter of 2013 and
decreased during the fourth quarter of 2013 compared to the fourth quarter of 2012.
Our merchandise gross profit as a percentage of merchandise sales increased to 36.8% in 2013 from 36.3%
in 2012. The increase in the merchandise gross profit as a percentage of merchandise sales in 2013 compared to
2012 was primarily due to the elimination of free shipping to Cabela’s CLUB members, increased penetration
of Cabela’s brand merchandise, fewer sales discounts and markdowns, and higher margins in a our soft goods
category. The increase in our merchandise gross profit as a percentage of merchandise sales was enhanced by the
shift from firearms and ammunition to our soft goods categories, and was partially offset by the overall increase in
sales of firearms and ammunition year over year, which carry a lower margin.
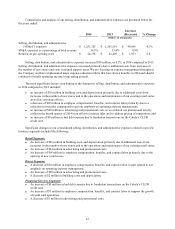
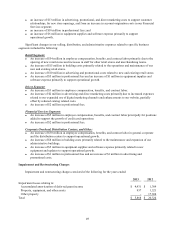
Selling, Distribution, and Administrative Expenses
Comparisons and analysis of our selling, distribution, and administrative expenses were as follows for the
years ended:
2013 2012
Increase
(Decrease) % Change
(Dollars in Thousands)
Selling, distribution, and administrative expenses $ 1,201,519 $ 1,046,861 $ 154,658 14.8%
SD&A expenses as a percentage of total revenue 33.4% 33.6% (0.2)%
Retail store pre-opening costs $ 22,405 $ 12,523 $ 9,882 78.9
Selling, distribution, and administrative expenses increased $155 million, or 14.8%, in 2013 compared to
2012. However, expressed as a percentage of total revenue, selling, distribution, and administrative expenses
decreased 20 basis points to 33.4% in 2013 compared to 33.6% in 2012. The most significant factors contributing to
the changes in selling, distribution, and administrative expenses in 2013 compared to 2012 included:
x an increase of $92 million in employee compensation, benefits, and contract labor primarily due to the
opening of new retail stores and increases in staff for other retail stores, merchandising support areas,
distribution centers, credit card growth support, and general corporate overhead support;
x an increase of $23 million in building costs and depreciation primarily related to the operations and
maintenance of our new and existing retail stores as well as corporate offices;