Cabela's 2014 Annual Report Download - page 117
Download and view the complete annual report
Please find page 117 of the 2014 Cabela's annual report below. You can navigate through the pages in the report by either clicking on the pages listed below, or by using the keyword search tool below to find specific information within the annual report.-
 1
1 -
2
-
3
-
4
-
5
-
6
-
7
-
8
-
9
-
10
-
11
-
12
-
13
-
14
-
15
-
16
-
17
-
18
-
19
-
20
-
21
-
22
-
23
-
24
-
25
-
26
-
27
-
28
-
29
-
30
-
31
-
32
-
33
-
34
-
35
-
36
-
37
-
38
-
39
-
40
-
41
-
42
-
43
-
44
-
45
-
46
-
47
-
48
-
49
-
50
-
51
-
52
-
53
-
54
-
55
-
56
-
57
-
58
-
59
-
60
-
61
-
62
-
63
-
64
-
65
-
66
-
67
-
68
-
69
-
70
-
71
-
72
-
73
-
74
-
75
-
76
-
77
-
78
-
79
-
80
-
81
-
82
-
83
-
84
-
85
-
86
-
87
-
88
-
89
-
90
-
91
-
92
-
93
-
94
-
95
-
96
-
97
-
98
-
99
-
100
-
101
-
102
-
103
-
104
-
105
-
106
-
 107
107 -
 108
108 -
 109
109 -
 110
110 -
 111
111 -
 112
112 -
 113
113 -
 114
114 -
 115
115 -
 116
116 -
 117
117 -
 118
118 -
 119
119 -
 120
120 -
 121
121 -
 122
122 -
 123
123 -
 124
124 -
 125
125 -
 126
126 -
 127
127 -
128
-
129
-
130
-
131
-
132
 |
 |

107
CABELA’S INCORPORATED AND SUBSIDIARIES
NOTES TO CONSOLIDATED FINANCIAL STATEMENTS
(Dollars in Thousands Except Share and Per Share Amounts)
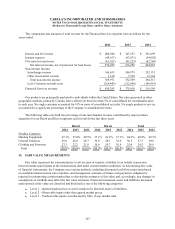
The components and amounts of total revenue for the Financial Services segment were as follows for the
years ended:
2014 2013 2012
Interest and fee income $ 400,948 $ 343,353 $ 301,699
Interest expense (64,167) (63,831) (54,092)
Provision for loan losses (61,922) (43,223) (42,760)
Net interest income, net of provision for loan losses 274,859 236,299 204,847
Non-interest income:
Interchange income 366,633 344,979 292,151
Other non-interest income 3,338 7,530 12,364
Total non-interest income 369,971 352,509 304,515
Less: Customer rewards costs (214,445) (212,998) (189,963)
Financial Services revenue $ 430,385 $ 375,810 $ 319,399
Our products are principally marketed to individuals within the United States. Net sales generated in other
geographic markets, primarily Canada, have collectively been less than 5% of consolidated net merchandise sales
in each year. No single customer accounted for 10% or more of consolidated net sales. No single product or service
accounted for a significant percentage of the Company’s consolidated revenue.
The following table sets forth the percentage of our merchandise revenue contributed by major product
categories for our Retail and Direct segments and in total for the last three years.
Retail Direct Total
2014 2013 2012 2014 2013 2012 2014 2013 2012
Product Category:
Hunting Equipment 47.1% 51.0% 49.5% 37.1% 41.2% 37.1% 44.3% 48.0% 45.3%
General Outdoors 29.6 26.8 28.7 32.0 29.1 32.0 30.3 27.5 29.8
Clothing and Footwear 23.3 22.2 21.8 30.9 29.7 30.9 25.4 24.5 24.9
Total 100.0% 100.0% 100.0% 100.0% 100.0% 100.0% 100.0% 100.0% 100.0%
24. FAIR VALUE MEASUREMENTS
Fair value represents the estimated price to sell an asset or transfer a liability in an orderly transaction
between market participants at the measurement date under current market conditions. In determining fair value
of financial instruments, the Company uses various methods, including discounted cash flow projections based
on available market interest rates and data, and management estimates of future cash payments. Judgment is
required in interpreting certain market data to develop the estimates of fair value and, accordingly, any changes in
assumptions or methods may affect the fair value estimates. Financial instrument assets and liabilities measured
and reported at fair value are classified and disclosed in one of the following categories:
x Level 1 – Quoted market prices in active markets for identical assets or liabilities.
x Level 2 – Observable inputs other than quoted market prices.
x Level 3 – Unobservable inputs corroborated by little, if any, market data.