Cabela's 2014 Annual Report Download - page 38
Download and view the complete annual report
Please find page 38 of the 2014 Cabela's annual report below. You can navigate through the pages in the report by either clicking on the pages listed below, or by using the keyword search tool below to find specific information within the annual report.-
 1
1 -
2
-
3
-
4
-
5
-
6
-
7
-
8
-
9
-
10
-
11
-
12
-
13
-
14
-
15
-
16
-
17
-
18
-
19
-
20
-
21
-
22
-
23
-
24
-
25
-
26
-
27
-
 28
28 -
 29
29 -
 30
30 -
 31
31 -
 32
32 -
 33
33 -
 34
34 -
 35
35 -
 36
36 -
 37
37 -
 38
38 -
 39
39 -
 40
40 -
 41
41 -
 42
42 -
 43
43 -
 44
44 -
 45
45 -
 46
46 -
 47
47 -
 48
48 -
49
-
50
-
51
-
52
-
53
-
54
-
55
-
56
-
57
-
58
-
59
-
60
-
61
-
62
-
63
-
64
-
65
-
66
-
67
-
68
-
69
-
70
-
71
-
72
-
73
-
74
-
75
-
76
-
77
-
78
-
79
-
80
-
81
-
82
-
83
-
84
-
85
-
86
-
87
-
88
-
89
-
90
-
91
-
92
-
93
-
94
-
95
-
96
-
97
-
98
-
99
-
100
-
101
-
102
-
103
-
104
-
105
-
106
-
107
-
108
-
109
-
110
-
111
-
112
-
113
-
114
-
115
-
116
-
117
-
118
-
119
-
120
-
121
-
122
-
123
-
124
-
125
-
126
-
127
-
128
-
129
-
130
-
131
-
132
 |
 |

28
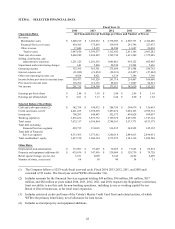
ITEM 6. SELECTED FINANCIAL DATA
Fiscal Year (1)
2014 2013 2012 2011 2010
Operations Data: (In Thousands Except Earnings per Share and Number of Stores)
Revenue:
Merchandise sales $ 3,200,219 $ 3,205,632 $ 2,778,903 $ 2,505,733 $ 2,412,486
Financial Services revenue 430,385 375,810 319,399 291,746 227,675
Other revenue 17,046 18,135 14,380 13,687 23,081
Total revenue 3,647,650 3,599,577 3,112,682 2,811,166 2,663,242
Total cost of revenue 2,060,289 2,030,829 1,769,798 1,613,249 1,575,449
Selling, distribution, and
administrative expenses 1,251,325 1,201,519 1,046,861 954,125 895,405
Impairment and restructuring charges 641 5,868 20,324 12,244 5,626
Operating income 335,395 361,361 275,699 231,548 186,762
Interest expense, net (21,842) (21,854) (20,123) (24,427) (27,442)
Other non-operating income, net 4,924 4,021 6,138 7,346 7,360
Income before provision for income taxes 318,477 343,528 261,714 214,467 166,680
Provision for income taxes 116,762 119,138 88,201 71,847 54,521
Net income $ 201,715 $ 224,390 $ 173,513 $ 142,620 $ 112,159
Earnings per basic share $ 2.84 $ 3.18 $ 2.48 $ 2.06 $ 1.65
Earnings per diluted share $ 2.81 $ 3.13 $ 2.42 $ 2.00 $ 1.62
Selected Balance Sheet Data:
Cash and cash equivalents (2) $ 142,758 $ 199,072 $ 288,750 $ 304,679 $ 136,419
Credit card loans, net (3) 4,421,185 3,938,630 3,497,472 3,094,163 2,709,312
Inventories 760,293 644,883 552,575 494,828 509,097
Working capital (2) 3,816,632 3,873,732 3,159,678 2,491,591 1,747,124
Total assets 7,675,317 6,396,864 5,748,163 5,133,771 4,531,179
Total debt excluding
Financial Services segment 499,715 331,065 336,535 344,922 345,152
Total debt of Financial
Services segment 4,333,306 3,571,612 3,200,518 2,844,813 2,496,651
Total stockholders’ equity 1,817,510 1,606,334 1,375,979 1,181,316 1,024,548
Other Data:
Depreciation and amortization $ 113,097 $ 93,407 $ 79,269 $ 71,343 $ 69,872
Property and equipment additions (4) $ 435,636 $ 347,956 $ 230,009 $ 120,739 $ 79,720
Retail square footage, at year end 6,911 5,890 5,142 4,682 4,409
Number of stores, at year end 6450403431
(1) The Company follows a 52/53 week fiscal year-end cycle. Fiscal 2014, 2013, 2012, 2011, and 2010 each
consisted of 52 weeks. The fiscal year end of WFB is December 31st.
(2) Includes amounts for the Financial Services segment totaling $49 million, $94 million, $91 million, $117
million, and $82 million at years ended 2014, 2013, 2012, 2011, and 2010, respectively. Regulatory restrictions
limit our ability to use this cash for non-banking operations, including its use as working capital for our
Retail or Direct businesses, or for retail store expansion.
(3) Includes restricted credit card loans of the Cabela’s Master Credit Card Trust and related entities, of which
WFB is the primary beneficiary, net of allowance for loan losses.
(4) Includes accrued property and equipment additions.