Cabela's 2014 Annual Report Download - page 7
Download and view the complete annual report
Please find page 7 of the 2014 Cabela's annual report below. You can navigate through the pages in the report by either clicking on the pages listed below, or by using the keyword search tool below to find specific information within the annual report.-
 1
1 -
 2
2 -
 3
3 -
 4
4 -
 5
5 -
 6
6 -
 7
7 -
 8
8 -
 9
9 -
 10
10 -
 11
11 -
 12
12 -
 13
13 -
 14
14 -
 15
15 -
 16
16 -
 17
17 -
 18
18 -
19
-
20
-
21
-
22
-
23
-
24
-
25
-
26
-
27
-
28
-
29
-
30
-
31
-
32
-
33
-
34
-
35
-
36
-
37
-
38
-
39
-
40
-
41
-
42
-
43
-
44
-
45
-
46
-
47
-
48
-
49
-
50
-
51
-
52
-
53
-
54
-
55
-
56
-
57
-
58
-
59
-
60
-
61
-
62
-
63
-
64
-
65
-
66
-
67
-
68
-
69
-
70
-
71
-
72
-
73
-
74
-
75
-
76
-
77
-
78
-
79
-
80
-
81
-
82
-
83
-
84
-
85
-
86
-
87
-
88
-
89
-
90
-
91
-
92
-
93
-
94
-
95
-
96
-
97
-
98
-
99
-
100
-
101
-
102
-
103
-
104
-
105
-
106
-
107
-
108
-
109
-
110
-
111
-
112
-
113
-
114
-
115
-
116
-
117
-
118
-
119
-
120
-
121
-
122
-
123
-
124
-
125
-
126
-
127
-
128
-
129
-
130
-
131
-
132
 |
 |

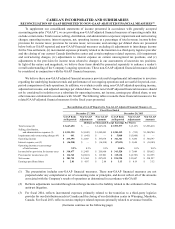
CABELA’S INCORPORATED AND SUBSIDIARIES
RECONCILIATION OF GAAP REPORTED TO NON-GAAP ADJUSTED FINANCIAL MEASURES(1)
To supplement our consolidated statements of income presented in accordance with generally accepted
accounting principles (“GAAP”), we are providing non-GAAP adjusted financial measures of operating results that
exclude certain items. Total revenue; selling, distribution, and administrative expenses; impairment and restructuring
charges; operating income; interest expense, net; operating income as a percentage of total revenue; income before
provision for income taxes; provision for income taxes; net income; and earnings per diluted share are presented
below both as GAAP reported and non-GAAP financial measures excluding (i) adjustments to interchange income
for the Visa settlement, (ii) incremental expenses primarily related to the transition to a third-party logistics provider
and the closing of our current Canada distribution center and certain employee related expenses, (iii) impairment
and restructuring charges, (iv) adjustments to interest expense on certain unrecognized tax positions, and (v)
adjustments to the provision for income taxes related to changes in our assessments of uncertain tax positions.
In light of the nature and magnitude, we believe these items should be presented separately to enhance a reader’s
overall understanding of the Company’s ongoing operations. These non-GAAP adjusted financial measures should
be considered in conjunction with the GAAP financial measures.
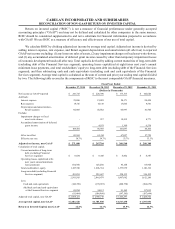
We believe these non-GAAP adjusted financial measures provide useful supplemental information to investors
regarding the underlying business trends and performance of our ongoing operations and are useful for period-over-
period comparisons of such operations. In addition, we evaluate results using non-GAAP adjusted operating income,
adjusted net income, and adjusted earnings per diluted share. These non-GAAP adjusted financial measures should
not be considered in isolation or as a substitute for operating income, net income, earnings per diluted share, or any
other measure calculated in accordance with GAAP. The following tables reconcile these financial measures to the
related GAAP adjusted financial measures for the fiscal years presented.
Reconciliation of GAAP Reported to Non-GAAP Adjusted Financial Measures (1)
Fiscal Year Ended
December 27, 2014 December 28, 2013
GAAP Basis
As Reported
Non-GAAP
Adjustments
Non-GAAP
Amounts
GAAP Basis
As Reported
Non-GAAP
Adjustments
Non-GAAP
Amounts
(Dollars in Thousands Except Earnings Per Share)
Total revenue (2) $ 3,647,650 $ — $ 3,647,650 $3,599,577 $ (3,167) $ 3,596,410
Selling, distribution,
and administrative expenses (3) $1,251,325 $(1,842) $1,249,483 $1,201,519 $ (735) $1,200,784
Impairment and restructuring charges (4) $641 $(641) $ — $ 5,868 $(5,868) $ —
Operating income $335,395 $2,483 $ 337,878 $ 361, 361 $3,436 $ 364,797
Interest expense, net (5) $(16,918) $— $(16,918)$(17,833) $3,648 $ (14,185)
Operating income as a percentage
of total revenue 9.2% 0.1% 9.3% 10.0% 0.1% 10.1%
Income before provision for income taxes $318,477 $2,483 $ 320,960 $343,528 $ 7,084 $ 350,612
Provision for income taxes (6) $116,762 $(2,861) $ 113,901 $ 119,138 $(6,783) $ 112,355
Net income $201,715 $5,344 $ 207,059 $224,390 $ 13,867 $ 238,257
Earnings per diluted share $2.81 $ 0.07 $ 2.88 $3.13 $0.19 $ 3.32
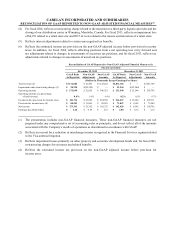
(1) The presentation includes non-GAAP financial measures. These non-GAAP financial measures are not
prepared under any comprehensive set of accounting rules or principles, and do not reflect all of the amounts
associated with the Company’s results of operations as determined in accordance with GAAP.
(2) Reflects adjustments recorded through interchange income to the liability related to the settlement of the Visa
antitrust litigation.
(3) For fiscal 2014, reflects incremental expenses primarily related to the transition to a third-party logistics
provider for our distribution needs in Canada and the closing of our distribution center in Winnipeg, Manitoba,
Canada. For fiscal 2013, reflects certain employee related expenses primarily related to severance benefits.
(footnotes continue on the following page)