Cabela's 2014 Annual Report Download - page 68
Download and view the complete annual report
Please find page 68 of the 2014 Cabela's annual report below. You can navigate through the pages in the report by either clicking on the pages listed below, or by using the keyword search tool below to find specific information within the annual report.-
 1
1 -
2
-
3
-
4
-
5
-
6
-
7
-
8
-
9
-
10
-
11
-
12
-
13
-
14
-
15
-
16
-
17
-
18
-
19
-
20
-
21
-
22
-
23
-
24
-
25
-
26
-
27
-
28
-
29
-
30
-
31
-
32
-
33
-
34
-
35
-
36
-
37
-
38
-
39
-
40
-
41
-
42
-
43
-
44
-
45
-
46
-
47
-
48
-
49
-
50
-
51
-
52
-
53
-
54
-
55
-
56
-
57
-
 58
58 -
 59
59 -
 60
60 -
 61
61 -
 62
62 -
 63
63 -
 64
64 -
 65
65 -
 66
66 -
 67
67 -
 68
68 -
 69
69 -
 70
70 -
 71
71 -
 72
72 -
 73
73 -
 74
74 -
 75
75 -
 76
76 -
 77
77 -
 78
78 -
79
-
80
-
81
-
82
-
83
-
84
-
85
-
86
-
87
-
88
-
89
-
90
-
91
-
92
-
93
-
94
-
95
-
96
-
97
-
98
-
99
-
100
-
101
-
102
-
103
-
104
-
105
-
106
-
107
-
108
-
109
-
110
-
111
-
112
-
113
-
114
-
115
-
116
-
117
-
118
-
119
-
120
-
121
-
122
-
123
-
124
-
125
-
126
-
127
-
128
-
129
-
130
-
131
-
132
 |
 |

58
forms of risk retention will satisfy the regulatory requirements, whether structural changes will be necessary, or
whether the risk retention requirement will impact the Financial Services segment’s ability or desire to continue to
rely on the securitization market for funding.
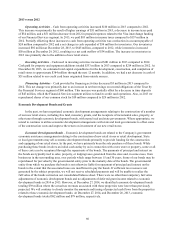
Operating, Investing and Financing Activities
The following table presents changes in our cash and cash equivalents for the years ended:
2014 2013 2012
(In Thousands)
Net cash provided by operating activities $ 257,979 $ 345,004 $ 234,629
Net cash used in investing activities (1,266,302) (793,031) (612,367)
Net cash provided by financing activities 956,775 358,349 361,809
2014 versus 2013
Operating Activities – Net cash provided from operating activities was $258 million in 2014 compared to
$345 million in 2013. We paid a deposit of $50 million in 2014 for federal taxes related to prior period uncertain tax
positions, which is the primary reason for the decrease of $71 million in the income tax accounts comparing the
respective years. In addition, we had net decreases of $45 million in prepaid expenses and other assets primarily
due to a timing difference in our Visa interchange funding for the Financial Services segment, $27 million in
inventories, and $23 million in accounts receivable. Partially offsetting these decreases in cash from operating
activities were increases of $80 million relating to accounts payable and accrued expenses and other liabilities
primarily due to increases in inventories and in the number of retail stores, $20 million in gift certificates,
credit card rewards, and loyalty rewards programs due to increased volume, and $20 million in depreciation and
amortization. We increased inventory levels by $115 million at December 27, 2014, to $760 million, compared to
2013, where our inventory levels increased $92 million compared to year end 2012. The increase in inventories in
2014 was primarily due to the addition of new retail stores.
Investing Activities – Cash used in investing activities increased $473 million in 2014 to $1.3 billion
compared to 2013. Cash paid for property and equipment additions totaled $441 million in 2014 compared
to $333 million in 2013. At December 27, 2014, the Company estimated it had total cash commitments of
approximately $524 million outstanding for projected expenditures related to the development, construction, and
completion of new retail stores, a new distribution center, and expansion of our corporate offices. This amount
excludes any estimated costs associated with new stores where the Company does not have a commitment as
of December 27, 2014. We expect to fund these estimated capital expenditures with funds from operations and
borrowings. In addition, we had decreases of $306 million related to the change in restricted cash of the Trust and
$60 million related to our credit card loans originated from outside sources. Our restricted cash of the Trust totaled
$335 million at December 27, 2014, as we repaid $255 million of Series 2010-I notes in full on January 15, 2015.
The following table presents the growth of our retail stores, and the activity of economic development bonds
related to the construction of these stores and related projects, for the years ended:
2014 2013
(Dollars in Thousands)
Cash paid for property and equipment additions $ 440,891 $ 333,009
Proceeds from retirements and maturities of economic development bonds 4,765 3,473
Number of new retail stores opened during the year, including the
Winnipeg relocation in 2013 14 11
Number of retail stores at the end of the year 64 50
Retail square footage at the end of the year 6,911,000 5,890,000