Cabela's 2014 Annual Report Download - page 47
Download and view the complete annual report
Please find page 47 of the 2014 Cabela's annual report below. You can navigate through the pages in the report by either clicking on the pages listed below, or by using the keyword search tool below to find specific information within the annual report.-
 1
1 -
2
-
3
-
4
-
5
-
6
-
7
-
8
-
9
-
10
-
11
-
12
-
13
-
14
-
15
-
16
-
17
-
18
-
19
-
20
-
21
-
22
-
23
-
24
-
25
-
26
-
27
-
28
-
29
-
30
-
31
-
32
-
33
-
34
-
35
-
36
-
 37
37 -
 38
38 -
 39
39 -
 40
40 -
 41
41 -
 42
42 -
 43
43 -
 44
44 -
 45
45 -
 46
46 -
 47
47 -
 48
48 -
 49
49 -
 50
50 -
 51
51 -
 52
52 -
 53
53 -
 54
54 -
 55
55 -
 56
56 -
 57
57 -
58
-
59
-
60
-
61
-
62
-
63
-
64
-
65
-
66
-
67
-
68
-
69
-
70
-
71
-
72
-
73
-
74
-
75
-
76
-
77
-
78
-
79
-
80
-
81
-
82
-
83
-
84
-
85
-
86
-
87
-
88
-
89
-
90
-
91
-
92
-
93
-
94
-
95
-
96
-
97
-
98
-
99
-
100
-
101
-
102
-
103
-
104
-
105
-
106
-
107
-
108
-
109
-
110
-
111
-
112
-
113
-
114
-
115
-
116
-
117
-
118
-
119
-
120
-
121
-
122
-
123
-
124
-
125
-
126
-
127
-
128
-
129
-
130
-
131
-
132
 |
 |

37
Product Sales Mix – The following table sets forth the percentage of our merchandise revenue contributed by
major product categories for our Retail and Direct segments and in total for the years ended:
Retail Direct Total
Product Category: 2014 2013 2014 2013 2014 2013
Hunting Equipment 47.1% 51.0% 37.1% 41.2% 44.3% 48.0%
General Outdoors 29.6 26.8 32.0 29.1 30.3 27.5
Clothing and Footwear 23.3 22.2 30.9 29.7 25.4 24.5
Total 100.0% 100.0% 100.0% 100.0% 100.0% 100.0%
The hunting equipment merchandise category includes a wide variety of firearms, ammunition, optics,
archery products, and related accessories and supplies. The general outdoors merchandise category includes
a full range of equipment and accessories supporting all outdoor activities, including all types of fishing and
tackle products, boats and marine equipment, camping gear and equipment, food preparation and outdoor
cooking products, all-terrain vehicles and accessories for automobiles and all-terrain vehicles, wildlife and land
management products and services, including compact tractors and tractor attachments, and gifts and home
furnishings. The clothing and footwear merchandise category includes fieldwear apparel and footwear, sportswear,
casual clothing and footwear, and workwear products.
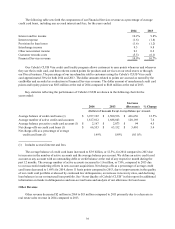
Retail Revenue – Retail revenue increased $117 million, or 5.3%, in 2014 compared to 2013 primarily due to
an increase of $376 million in revenue from the addition of new retail stores. Our new format retail stores continue
to generate an increase in sales per square foot compared to our legacy stores.
The increase in retail revenue from new retail stores was partially offset by a decrease in comparable store
sales of $255 million. Comparable store sales were down across all major product categories comparing 2014 to
2013, but primarily in the hunting equipment product category, mostly due to the decrease in sales of firearms and
ammunition. We believe that the decreases in sales of firearms and ammunition have begun to level out, and we
expect sales of firearms and ammunition to return to more normalized levels in fiscal 2015.
We recognize revenue as gift certificates, gift cards, and e-certificates (“gift instruments”) are redeemed for
merchandise or services. We record gift instrument breakage as Retail revenue when the probability of redemption
is remote. Gift instrument breakage recognized was $9 million and $7 million for 2014 and 2013, respectively. Our
gift instrument liability at the end of 2014 and 2013 was $175 million and $145 million, respectively.
Comparable store sales and analysis are presented below for the years ended:
2014 2013
Increase
(Decrease)
(Dollars in Thousands)
Comparable stores sales $ 1,815,938 $ 2,070,981 $ (255,043)
Comparable stores sales increase (decrease) percentage (12.3)% 3.9%
Comparable store sales decreased $255 million, or 12.3%, in 2014 compared to 2013. Comparable store sales
were down across all major product categories, but primarily in the hunting equipment product category. A store is
included in our comparable store sales base on the first day of the month following the fifteen month anniversary
of 1) its opening or acquisition, or 2) any changes to retail store space greater than 25% of total square footage of
the store.
Average sales per square foot for stores that were open during the entire year were $348 for 2014 compared
to $385 for 2013 due to the reasons discussed in the previous paragraph. However, our new format retail stores
continued to perform better on a sales per square foot basis than our legacy stores.