Cabela's 2014 Annual Report Download - page 114
Download and view the complete annual report
Please find page 114 of the 2014 Cabela's annual report below. You can navigate through the pages in the report by either clicking on the pages listed below, or by using the keyword search tool below to find specific information within the annual report.-
 1
1 -
2
-
3
-
4
-
5
-
6
-
7
-
8
-
9
-
10
-
11
-
12
-
13
-
14
-
15
-
16
-
17
-
18
-
19
-
20
-
21
-
22
-
23
-
24
-
25
-
26
-
27
-
28
-
29
-
30
-
31
-
32
-
33
-
34
-
35
-
36
-
37
-
38
-
39
-
40
-
41
-
42
-
43
-
44
-
45
-
46
-
47
-
48
-
49
-
50
-
51
-
52
-
53
-
54
-
55
-
56
-
57
-
58
-
59
-
60
-
61
-
62
-
63
-
64
-
65
-
66
-
67
-
68
-
69
-
70
-
71
-
72
-
73
-
74
-
75
-
76
-
77
-
78
-
79
-
80
-
81
-
82
-
83
-
84
-
85
-
86
-
87
-
88
-
89
-
90
-
91
-
92
-
93
-
94
-
95
-
96
-
97
-
98
-
99
-
100
-
101
-
102
-
103
-
 104
104 -
 105
105 -
 106
106 -
 107
107 -
 108
108 -
 109
109 -
 110
110 -
 111
111 -
 112
112 -
 113
113 -
 114
114 -
 115
115 -
 116
116 -
 117
117 -
 118
118 -
 119
119 -
 120
120 -
 121
121 -
 122
122 -
 123
123 -
 124
124 -
125
-
126
-
127
-
128
-
129
-
130
-
131
-
132
 |
 |

104
CABELA’S INCORPORATED AND SUBSIDIARIES
NOTES TO CONSOLIDATED FINANCIAL STATEMENTS
(Dollars in Thousands Except Share and Per Share Amounts)
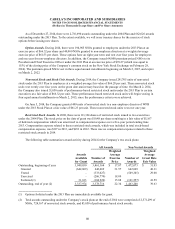
The following table reconciles the Company’s treasury stock activity for the years ended:
2014 2013
Balance, beginning of year - 492,414
Purchase of treasury stock at a cost of $10,053(1) - 181,179
Treasury shares issued on exercise of stock options and share-based payment awards - (673,593)
Balance, end of year - -
(1) Reflects common stock withheld (under the terms of grants pursuant to a stock compensation plan)
totaling 17,439 shares to offset tax withholding obligations upon the vesting and release of restricted shares
on July 7, 2013.
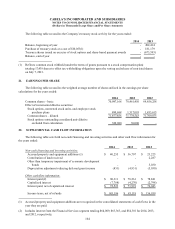
21. EARNINGS PER SHARE
The following table reconciles the weighted average number of shares utilized in the earnings per share
calculations for the years ended:
2014 2013 2012
Common shares – basic 70,987,168 70,461,450 69,856,258
Effect of incremental dilutive securities:
Stock options, nonvested stock units, and employee stock
purchase plans 890,688 1,317,093 1,853,615
Common shares – diluted 71,877,856 71,778,543 71,709,873
Stock options outstanding considered anti-dilutive
excluded from calculation 389,080 30,000 -
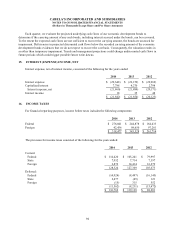
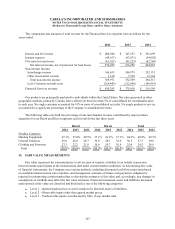
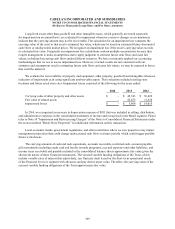
22. SUPPLEMENTAL CASH FLOW INFORMATION
The following table sets forth non-cash financing and investing activities and other cash flow information for
the years ended:
2014 2013 2012
Non-cash financing and investing activities:
Accrued property and equipment additions (1) $ 40,255 $ 36,707 $ 23,225
Contribution of land received - - 2,287
Other than temporary impairment of economic development
bonds - - 5,030
Depreciation adjustment reducing deferred grant income (831) (4,931) (5,030)
Other cash flow information:
Interest paid (2) $ 80,311 $ 78,261 $ 78,841
Capitalized interest (7,788) (4,270) (2,798)
Interest paid, net of capitalized interest $ 72,523 $ 73,991 $ 76,043
Income taxes, net of refunds $ 145,196 $ 83,118 $ 136,959
(1) Accrued property and equipment additions are recognized in the consolidated statements of cash flows in the
year they are paid.
(2) Includes interest from the Financial Services segment totaling $64,009, $63,363, and $54,301 for 2014, 2013,
and 2012, respectively.