Cabela's 2014 Annual Report Download - page 95
Download and view the complete annual report
Please find page 95 of the 2014 Cabela's annual report below. You can navigate through the pages in the report by either clicking on the pages listed below, or by using the keyword search tool below to find specific information within the annual report.-
 1
1 -
2
-
3
-
4
-
5
-
6
-
7
-
8
-
9
-
10
-
11
-
12
-
13
-
14
-
15
-
16
-
17
-
18
-
19
-
20
-
21
-
22
-
23
-
24
-
25
-
26
-
27
-
28
-
29
-
30
-
31
-
32
-
33
-
34
-
35
-
36
-
37
-
38
-
39
-
40
-
41
-
42
-
43
-
44
-
45
-
46
-
47
-
48
-
49
-
50
-
51
-
52
-
53
-
54
-
55
-
56
-
57
-
58
-
59
-
60
-
61
-
62
-
63
-
64
-
65
-
66
-
67
-
68
-
69
-
70
-
71
-
72
-
73
-
74
-
75
-
76
-
77
-
78
-
79
-
80
-
81
-
82
-
83
-
84
-
 85
85 -
 86
86 -
 87
87 -
 88
88 -
 89
89 -
 90
90 -
 91
91 -
 92
92 -
 93
93 -
 94
94 -
 95
95 -
 96
96 -
 97
97 -
 98
98 -
 99
99 -
 100
100 -
 101
101 -
 102
102 -
 103
103 -
 104
104 -
 105
105 -
106
-
107
-
108
-
109
-
110
-
111
-
112
-
113
-
114
-
115
-
116
-
117
-
118
-
119
-
120
-
121
-
122
-
123
-
124
-
125
-
126
-
127
-
128
-
129
-
130
-
131
-
132
 |
 |

85
CABELA’S INCORPORATED AND SUBSIDIARIES
NOTES TO CONSOLIDATED FINANCIAL STATEMENTS
(Dollars in Thousands Except Share and Per Share Amounts)
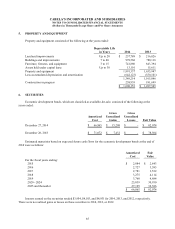
5. PROPERTY AND EQUIPMENT
Property and equipment consisted of the following at the years ended:
Depreciable Life
in Years 2014 2013
Land and improvements Up to 20 $ 257,788 $ 216,826
Buildings and improvements 7 to 40 978,568 780,116
Furniture, fixtures, and equipment 3 to 15 741,880 643,394
Assets held under capital lease Up to 30 13,101 15,611
Property and equipment 1,991,337 1,655,947
Less accumulated depreciation and amortization (642,123) (550,101)
1,349,214 1,105,846
Construction in progress 258,939 181,699
$ 1,608,153 $ 1,287,545
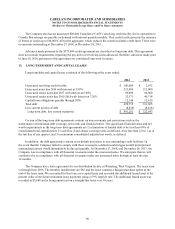
6. SECURITIES
Economic development bonds, which are classified as available-for-sale, consisted of the following at the
years ended:
Amortized
Cost
Gross
Unrealized
Gains
Gross
Unrealized
Losses Fair Value
December 27, 2014 $ 66,865 $ 15,209 $ - $ 82,074
December 28, 2013 $ 71,072 $ 7,432 $ - $ 78,504
Estimated maturities based on expected future cash flows for the economic development bonds at the end of
2014 were as follows:
Amortized
Cost
Fair
Value
For the fiscal years ending:
2015 $ 2,084 $ 2,843
2016 2,727 3,585
2017 2,781 3,532
2018 3,275 4,114
2019 3,760 4,684
2020 - 2024 25,039 30,930
2025 and thereafter 27,199 32,386
$ 66,865 $ 82,074
Interest earned on the securities totaled $3,954, $4,103, and $4,931 for 2014, 2013, and 2012, respectively.
There were no realized gains or losses on these securities in 2014, 2013, or 2012.