Cabela's 2014 Annual Report Download - page 88
Download and view the complete annual report
Please find page 88 of the 2014 Cabela's annual report below. You can navigate through the pages in the report by either clicking on the pages listed below, or by using the keyword search tool below to find specific information within the annual report.-
 1
1 -
2
-
3
-
4
-
5
-
6
-
7
-
8
-
9
-
10
-
11
-
12
-
13
-
14
-
15
-
16
-
17
-
18
-
19
-
20
-
21
-
22
-
23
-
24
-
25
-
26
-
27
-
28
-
29
-
30
-
31
-
32
-
33
-
34
-
35
-
36
-
37
-
38
-
39
-
40
-
41
-
42
-
43
-
44
-
45
-
46
-
47
-
48
-
49
-
50
-
51
-
52
-
53
-
54
-
55
-
56
-
57
-
58
-
59
-
60
-
61
-
62
-
63
-
64
-
65
-
66
-
67
-
68
-
69
-
70
-
71
-
72
-
73
-
74
-
75
-
76
-
77
-
 78
78 -
 79
79 -
 80
80 -
 81
81 -
 82
82 -
 83
83 -
 84
84 -
 85
85 -
 86
86 -
 87
87 -
 88
88 -
 89
89 -
 90
90 -
 91
91 -
 92
92 -
 93
93 -
 94
94 -
 95
95 -
 96
96 -
 97
97 -
 98
98 -
99
-
100
-
101
-
102
-
103
-
104
-
105
-
106
-
107
-
108
-
109
-
110
-
111
-
112
-
113
-
114
-
115
-
116
-
117
-
118
-
119
-
120
-
121
-
122
-
123
-
124
-
125
-
126
-
127
-
128
-
129
-
130
-
131
-
132
 |
 |
78
CABELA’S INCORPORATED AND SUBSIDIARIES
NOTES TO CONSOLIDATED FINANCIAL STATEMENTS
(Dollars in Thousands Except Share and Per Share Amounts)
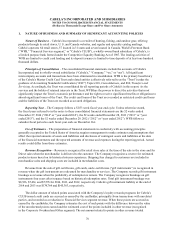
track historical loss experience on delinquent accounts, bankruptcies, death, and charge-offs, net of estimated
recoveries. The Financial Services segment uses a migration analysis and historical bankruptcy and death rates
to estimate the likelihood that a credit card loan in the credit card loan segment will progress through the various
stages of delinquency and to charge-off. This analysis estimates the gross amount of principal that will be charged
off over the next 12 months, net of recoveries. The Financial Services segment uses historical charge-off rates
to estimate the charge-offs over the life of the restructured credit card loan, net of recoveries. This estimate is
used to derive an estimated allowance for loan losses. In addition to these methods of measurement, management
also considers other factors such as general economic and business conditions affecting key lending areas, credit
concentration, changes in origination and portfolio management, and credit quality trends. Since the evaluation
of the inherent loss with respect to these factors is subject to a high degree of uncertainty, the measurement of
the overall allowance is subject to estimation risk, and the amount of actual losses can vary significantly from the
estimated amounts.
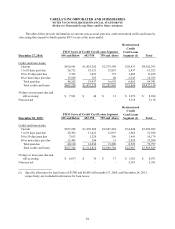
Credit card loans that have been modified through a fixed payment plan or placed on non-accrual are
considered impaired and are collectively evaluated for impairment. The Financial Services segment charges
off credit card loans and restructured credit card loans on a daily basis after an account becomes at a minimum
130 days contractually delinquent. Accounts relating to cardholder bankruptcies, cardholder deaths, and fraudulent
transactions are charged off earlier. The Financial Services segment recognizes charged-off cardholder fees and
accrued interest receivable in interest and fee income that is included in Financial Services revenue.
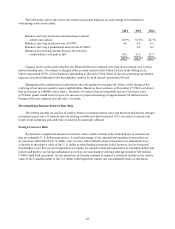
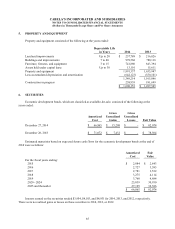
Inventories – Inventories are stated at the lower of average cost or market. All inventories are finished goods.
The reserve for inventory shrinkage, estimated based on cycle and physical counts, was $9,368 and $6,573 at the
end of 2014 and 2013, respectively. The reserves for returns of damaged goods, obsolescence, and slow-moving
items, estimated based upon historical experience, inventory aging, and specific identification, were $7,641 and
$5,872 at the end of 2014 and 2013, respectively.
Vendor Allowances – Vendor allowances include price allowances, volume rebates, store opening costs
reimbursements, marketing participation, and advertising reimbursements received from vendors under vendor
contracts. Vendor merchandise allowances are recognized as a reduction of the costs of merchandise as sold.
Vendor reimbursements of costs are recorded as a reduction to expense in the period the related cost is incurred
based on actual costs incurred. Any cost reimbursements exceeding expenses incurred are recognized as a
reduction of the cost of merchandise sold. Volume allowances may be estimated based on historical purchases and
estimates of projected purchases.
Deferred Catalog Costs and Advertising – Advertising production costs are expensed as the advertising
occurs except for catalog costs which are amortized over the expected period of benefit estimated at three to
12 months after mailing. Unamortized catalog costs totaled $2,952 and $5,445 at the end of 2014 and 2013,
respectively. Advertising expense, including direct marketing costs (amortization of catalog costs and website
marketing paid search fees), was $236,431, $208,184, and $201,456 for 2014, 2013, and 2012, respectively.
Advertising vendor reimbursements, netted in advertising expense discussed above, totaled $3,564, $2,623, and
$3,049 for 2014, 2013, and 2012, respectively.
Store Pre-opening Expenses – Non-capital costs associated with the opening of new stores are expensed
as incurred.
Leases – The Company leases certain retail locations, distribution centers, office space, equipment, and land.
Assets held under capital lease are included in property and equipment. Operating lease rentals are expensed on
a straight-line basis over the life of the lease. At the inception of a lease, the Company determines the lease term
by assuming the exercise of those renewal options that are reasonably assured because of the significant economic
penalty that exists for not exercising those options. The exercise of lease renewal options is at the Company’s sole