Cabela's 2014 Annual Report Download - page 40
Download and view the complete annual report
Please find page 40 of the 2014 Cabela's annual report below. You can navigate through the pages in the report by either clicking on the pages listed below, or by using the keyword search tool below to find specific information within the annual report.-
 1
1 -
2
-
3
-
4
-
5
-
6
-
7
-
8
-
9
-
10
-
11
-
12
-
13
-
14
-
15
-
16
-
17
-
18
-
19
-
20
-
21
-
22
-
23
-
24
-
25
-
26
-
27
-
28
-
29
-
 30
30 -
 31
31 -
 32
32 -
 33
33 -
 34
34 -
 35
35 -
 36
36 -
 37
37 -
 38
38 -
 39
39 -
 40
40 -
 41
41 -
 42
42 -
 43
43 -
 44
44 -
 45
45 -
 46
46 -
 47
47 -
 48
48 -
 49
49 -
 50
50 -
51
-
52
-
53
-
54
-
55
-
56
-
57
-
58
-
59
-
60
-
61
-
62
-
63
-
64
-
65
-
66
-
67
-
68
-
69
-
70
-
71
-
72
-
73
-
74
-
75
-
76
-
77
-
78
-
79
-
80
-
81
-
82
-
83
-
84
-
85
-
86
-
87
-
88
-
89
-
90
-
91
-
92
-
93
-
94
-
95
-
96
-
97
-
98
-
99
-
100
-
101
-
102
-
103
-
104
-
105
-
106
-
107
-
108
-
109
-
110
-
111
-
112
-
113
-
114
-
115
-
116
-
117
-
118
-
119
-
120
-
121
-
122
-
123
-
124
-
125
-
126
-
127
-
128
-
129
-
130
-
131
-
132
 |
 |

30
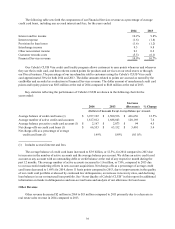
Fiscal 2014 Executive Overview
2014 2013
Increase
(Decrease) % Change
(Dollars in Thousands Except Earnings Per Diluted Share)
Revenue:
Retail $ 2,350,685 $ 2,233,322 $ 117,363 5.3%
Direct 851,738 973,614 (121,876) (12.5)
Total 3,202,423 3,206,936 (4,513) (0.1)
Financial Services 430,385 375,810 54,575 14.5
Other revenue 14,842 16,831 (1,989) (11.8)
Total revenue $ 3,647,650 $ 3,599,577 $ 48,073 1.3
Operating income $ 335,395 $ 361,361 $ (25,966) (7.2)
Net income $ 201,715 $ 224,390 $ (22,675) (10.1)
Earnings per diluted share $ 2.81 $ 3.13 $ (0.32) (10.2)
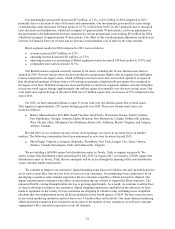
Revenues presented in the table above are consistent with our presentation for total revenue as reported by
segment. Revenues for 2014 totaled $3.6 billion, an increase of $48 million, or 1.3%, over 2013. Total merchandise
sales decreased $5 million, or 0.1%, in 2014 compared to 2013. The most significant factors contributing to the net
decrease in total merchandise sales comparing 2014 to 2013 were:
x A decrease of $255 million, or 12.3%, in comparable store sales that extended across all product
categories, led by a decrease in the hunting equipment product category. The sales of firearms and
ammunition, which are in the hunting equipment product category, decreased significantly comparing
2014 to 2013. We believe the decreases in firearms and ammunition sales have begun to level out, and we
expect firearms and ammunition sales in 2015 to return to more normalized, pre-surge 2013, levels. In
2013, demand increased for firearms, ammunition, and shooting supplies, as consumers stockpiled these
items, primarily due to the concerns for potential gun control legislation.
x A decrease in Direct revenue of $122 million, primarily due to a decrease in the hunting equipment
product category, mostly due to a substantial decrease in ammunition sales compared to 2013, and
expected cannibalization from our new retail stores.
x An increase in Retail revenue from new stores of $376 million in 2014 compared to 2013.
In addition, our Cabela’s branded products continue to be a core focus for us, as we saw growth in Cabela’s
branded clothing and footwear and general outdoors categories in 2014 compared to 2013. In 2014, our Cabela’s
branded merchandise accounted for approximately 26% of our merchandise revenue compared to approximately
25% in 2013.
Financial Services revenue increased $55 million, or 14.5%, in 2014 compared to 2013 due to increases in
interest income and interchange income, partially offset by increases in the provision for loan losses.
Operating income decreased $26 million, or 7.2%, for 2014 compared to 2013, and operating income as a
percentage of revenue decreased 80 basis points to 9.2% in 2014 compared to 10.0% in 2013. The decreases in total
operating income and total operating income as a percentage of total revenue were primarily due to an increase in
selling, distribution, and administrative expenses, a decrease in revenue from our Direct business segment, and a
decrease in our merchandise gross profit. These decreases to operating income were partially offset by increased
operating income contributions from our Financial Services segment.